Service Design

How might we uncover breakthrough revenue opportunities for Global Mail Solutions through an improved small business experience?

Growth & Customer Experience Strategy
Role:
UX/ UI Designer, Service Designer, & Researcher
Other Team Members: Service Design Lead, Visual Designer, Business Designer Lead
Time: a 4.5 month project

*To comply with my non-disclosure agreement, I have omitted, redacted, and changed names, data, and all confidential information in this project.

Overview

Smart Label Creator® (SLC) – Global Mail Solutions' (GMS) online label creation platform – faced a declining customer base along with declining revenues, in part, due to a lack of focus on the customer experience.

Our team worked with GMS to understand how it can elevate SLC’s customer experience to deliver breakthrough growth opportunities. We took a multi-disciplinary approach combining service design methodologies with analytics and customer segmentation to understand SLC’s customer base, their needs, shipping behavior, attitudes, and preferences.

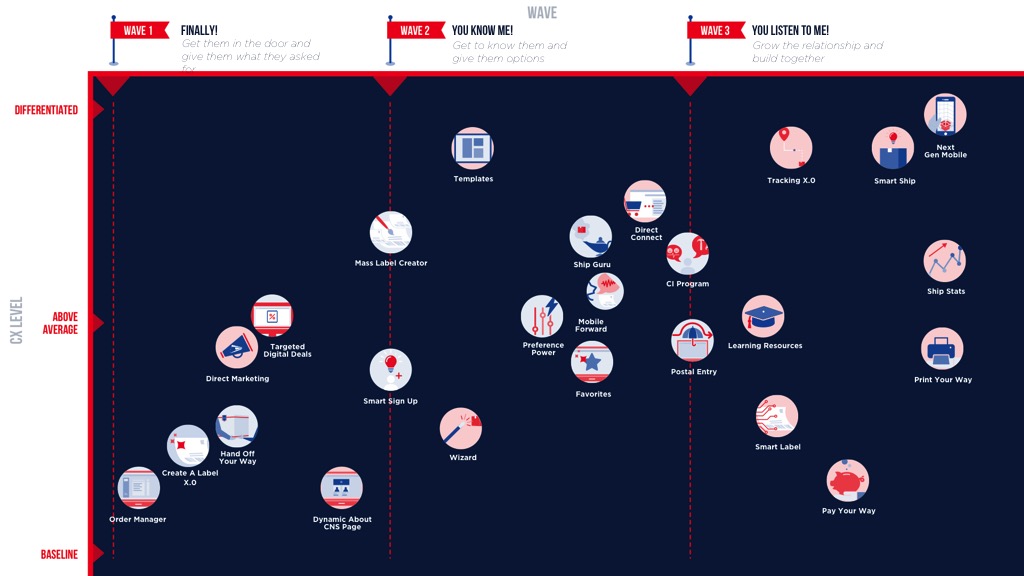
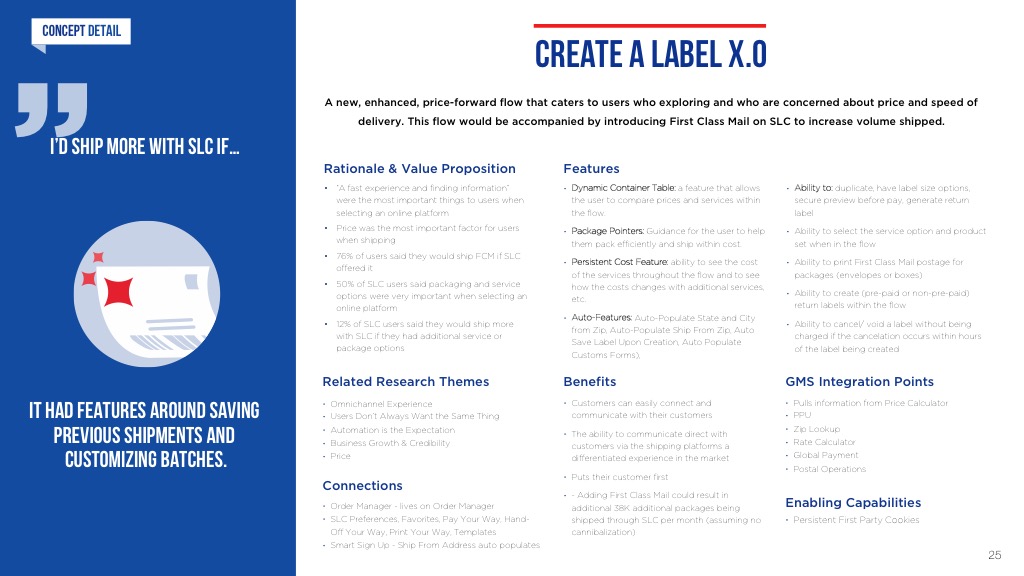
We learned that 80% of SLC's revenue was derived from 47% of customers who hold business – vs personal – accounts, and focused the research on this customer set. We identified six existing and new small business user segments based on their specific shipping habits, needs, and pain points, and created and prioritized 25 concepts – represented through future state journeys – that sought to improve the experience and ultimately grow revenue.

As part of the effort, we analyzed ~800K customer accounts, conducted 27 interviews and observations, visited 2 GMS Offices, surveyed ~5K customers, and created five unique customer segments which informed final concepts.

The Challenge: How might we uncover breakthrough revenue opportunities through an improved small business experience?

gms_photoresearchcollage (1).jpg

Discovery

Current State Experience

We developed a Current State Blueprint that visualized the customer’s current experience with SLC, highlighting both front stage - flow, functionality, touchpoints, high points and low points, user interactions – and backstage including stakeholder groups, technologies, and processes that support the customer across the journey.

Our goal was to show our client that the current experience was complicated and lengthy and there were many gaps in service between different applications. We also wanted to show moments of opportunity for an improved user experience.

CSB_mockup.jpg

Customer & Stakeholder Research

Using the initial value segments as a guide, the team used a variety of service design research methods to understand high value user’s pain points, needs, preferences, mindsets, and shipping habits. This included:

- 2 immersion trips to busy GMS Offices

- 3 at home/office visits using contextual inquiry and observation

- 24 phone interviews covering existing, prospective, and lost customers

- 3 GMS stakeholder interviews (Product Owner, Marketing, Contact Center)

We looked at GMS’ direct, experiential, and perceptual competitors to understand where SLC fits and how it compares in the minds of small business users. The team evaluated SLC’s positioning based on shipping and small business trends, experiences and functions important to users, and SLC's ability to meet those needs.

Using the initial insights gathered from the research, we validated key hypothesis and gathered additional data on small business’s attitudes, needs, and preferences by conducting a 24 question survey and sending it to over 200K SLC business users. Over 6K responses were received and analyzed.

We analyzed the research inputs and developed 19 themes, 5 customer segments and personas that had unique shipping behaviors, needs, and pain points, in addition to 2 new small business customer segments that SLC was not serving.


Segments & Personas

Segments

We analyzed existing SLC transactional data across 876K customers and found that 80% of SLC’s revenue and volume came from 47% of its customers and that these customers represented business account owners. The team also identified additional spend and frequency segments to understand how much customers were spending and how often and analyzed existing census and demographic and firmographic data from Equifax to understand more about the user’s profile.

We used this information to focus our research on this small and micro business audience.

persona_mockup.jpg

Personas

Taking into account both the communities and the individuals, we developed seven personas, backed by data, that we used to help shape future-state ideas and concepts.

While each user falls within a segment (not including 2 personas of the future we developed), our research showed that as users begins the ‘create a label experience’, different segments can come in with similar mindsets that affect what they need in an experience:

Business mindsets - These mindsets fall across two spectrums – Growth and Clarity

Experience needs - These mindsets shape the kind of experience they want and expect from an online solution

segment example.jpg

You can read more about how we combined customer segmentation data with the design research process by clicking here.

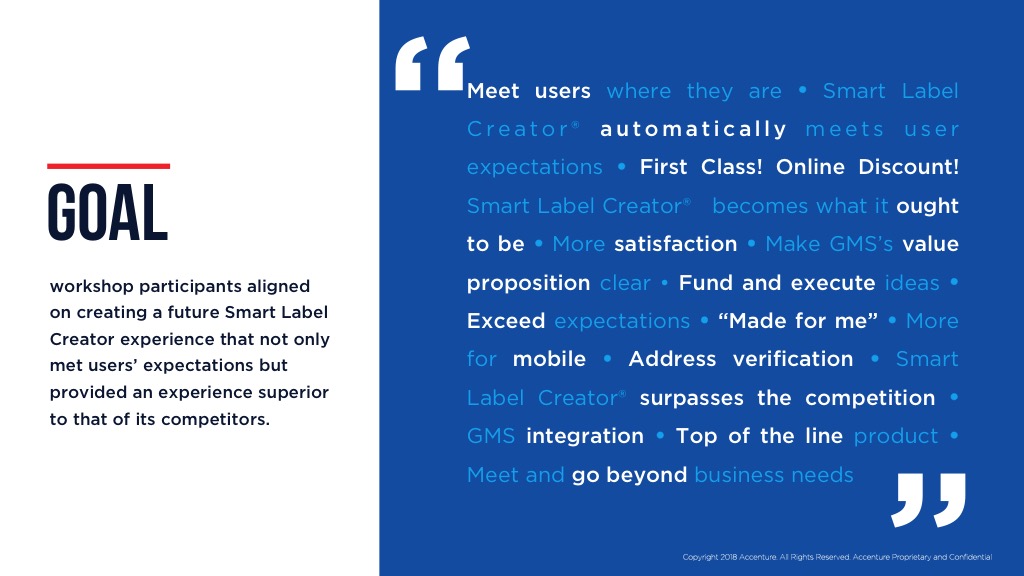
Innovation Workshop

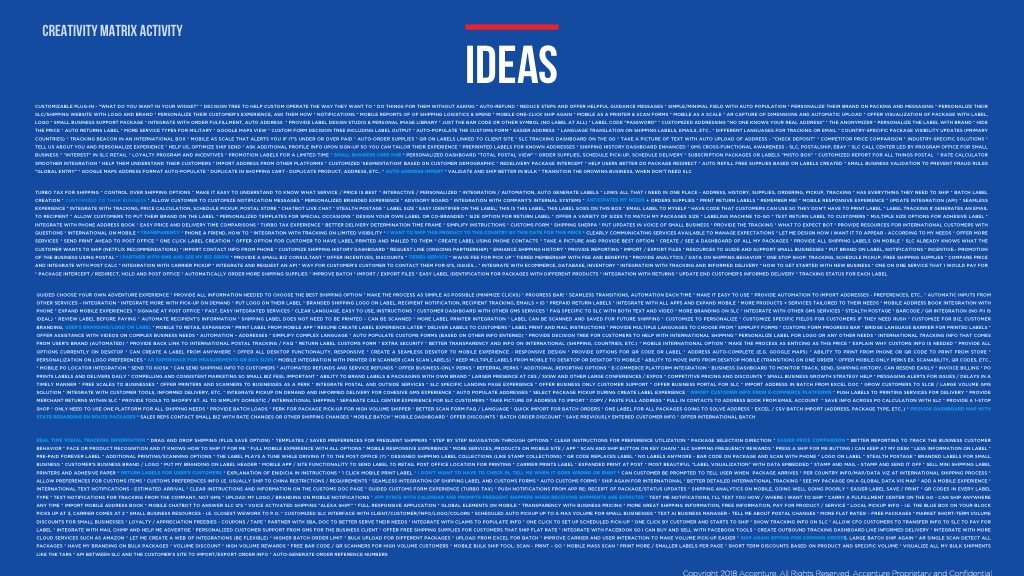
We concluded the research portion of the project with an innovation workshop. We presented the research and synthesized results to the client and their team; then led the group through a series of engaging activities to brainstorm and refine concepts for the future label creator.

Future State Experience

We synthesized the workshop ideas, incorporating comparative learning and concept areas from initial user research. Then we validated concept areas with the client team and subject matter advisors. We continued to combine, refine, and further develop concepts, features, and characteristics to build the future state experience and strategy.

*Client name and logo redacted

Concept Wireframes

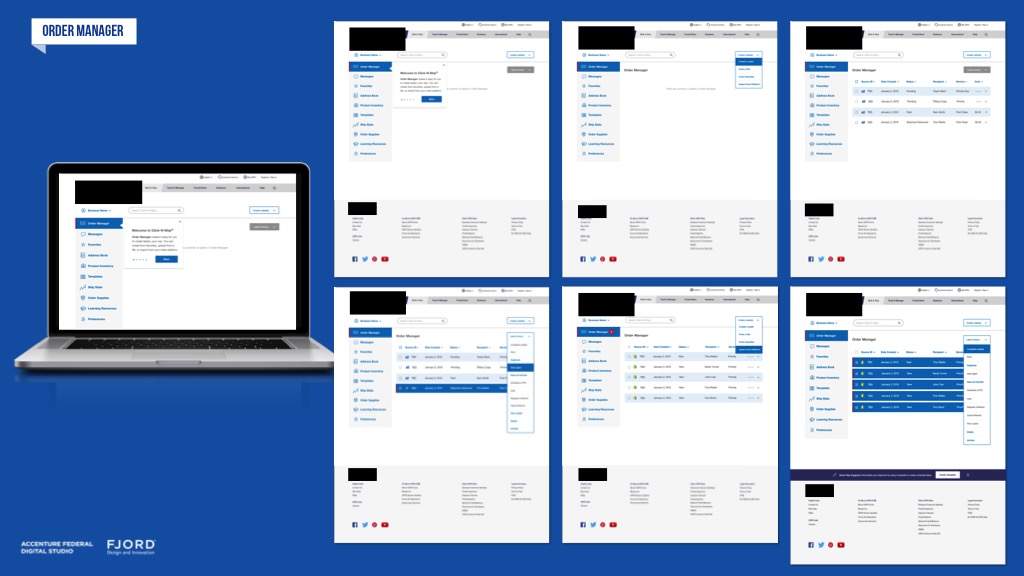
To demonstrate how some of the ideas from the workshop could be implemented in an updated design we prototyped several wireframes. We created two different concepts to help solve for two different flows.

The first concept solved for the 'create a label experience'. While the second concept solves for the bulk label experience which currently does not exist for SLC.

The styling varies between the two concepts because GMS created a brand style guide during the process. We were able to implement and expand on the style guide for the second concept.

GMS_flow_2.jpg

Concept 1 | Questionnaire for Label Creator

The first concept solved for the 'create a label experience'. We completely reimagined how a user would create a single label.

To simplify the current process and to help empower the user, we added a few questions upfront that could help quicken the process later on by using this information.

It would also help SLC personalize the service for the user and provide the best experience.

GMS_quote.jpg

Concept 1 | Personalized Quotes for Label Creator

During our research, we discovered that there is a lack of knowledge and transparency surrounding pricing that it's lowering users trust and potentially damaging the perception of SLC. Users wanted to move through the process as quickly as possible with a streamlined process and direct options. They want to be able to explore shipping and product options before creating a label.

They are focused on what they can learn and how to optimize their experience.

Using information from the questionnaire, they would land on a table that would maximize different factors (e.g., price, delivery speed, minimum breakage, maximum insurance) depending on their situation. The user could then compare and make the best-informed shipping/product decision for their needs.

GMS_questions_screens.jpg

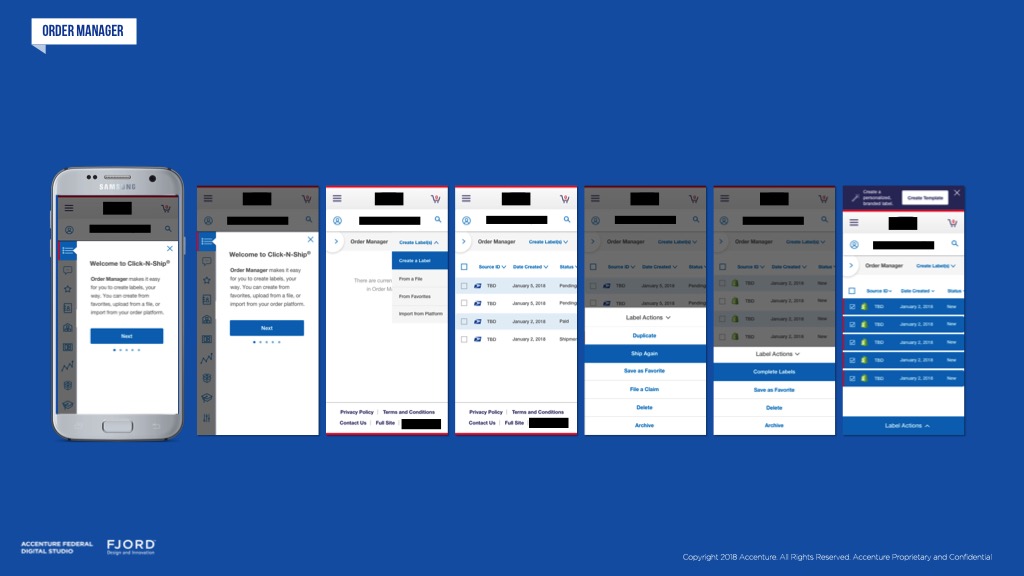
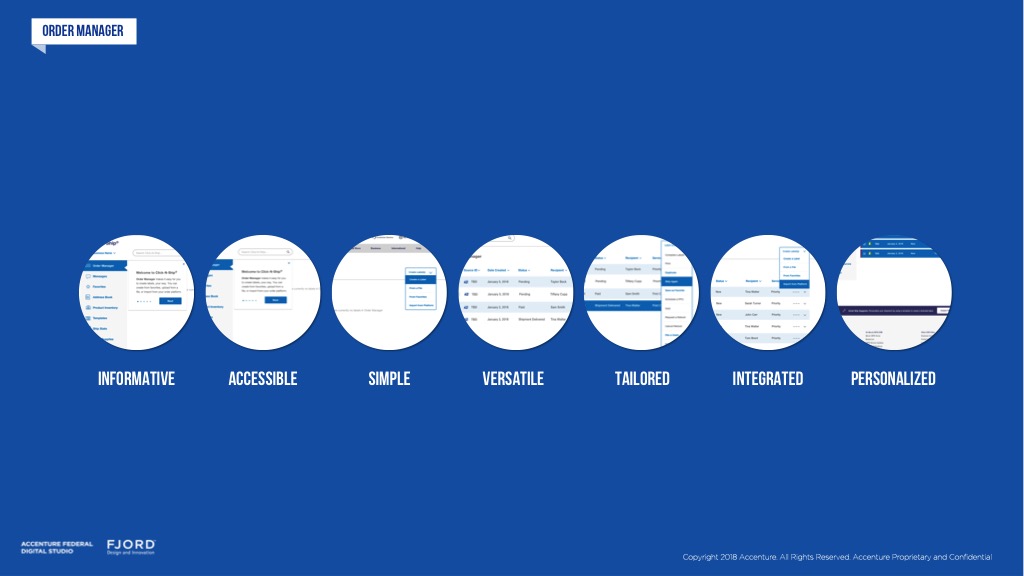
Concept 2 | Bulk Label Experience

In concept two we explored an efficient way for SLC users to create bulk labels and to pull in orders from multiple types of eCommerce and other channels. We illustrated how the concept could transition from computer to mobile; and highlighted how guiding principles discussed in the workshop came to life in the design.

*Client name and logo redacted
Concept Roadmap & Strategy

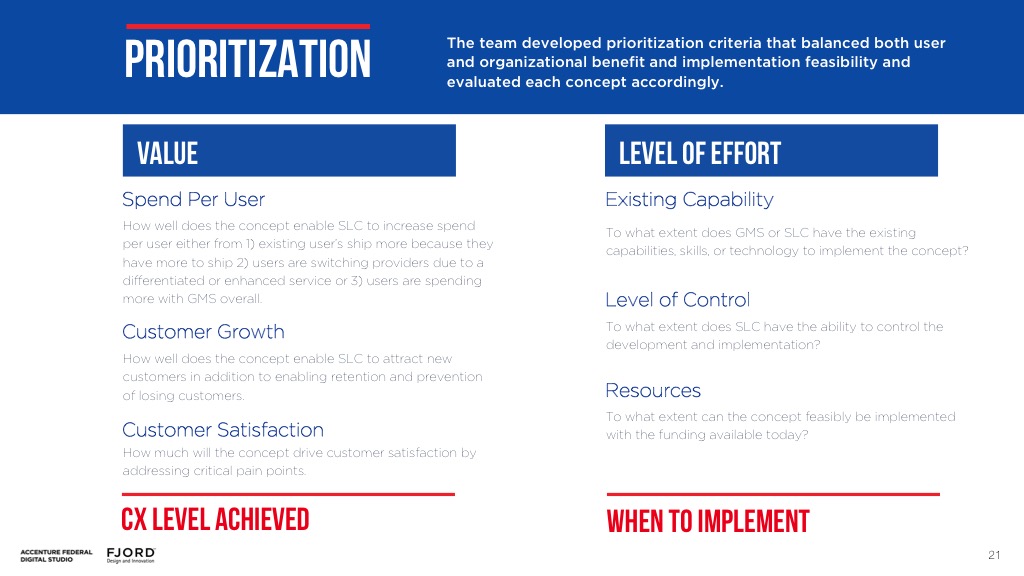
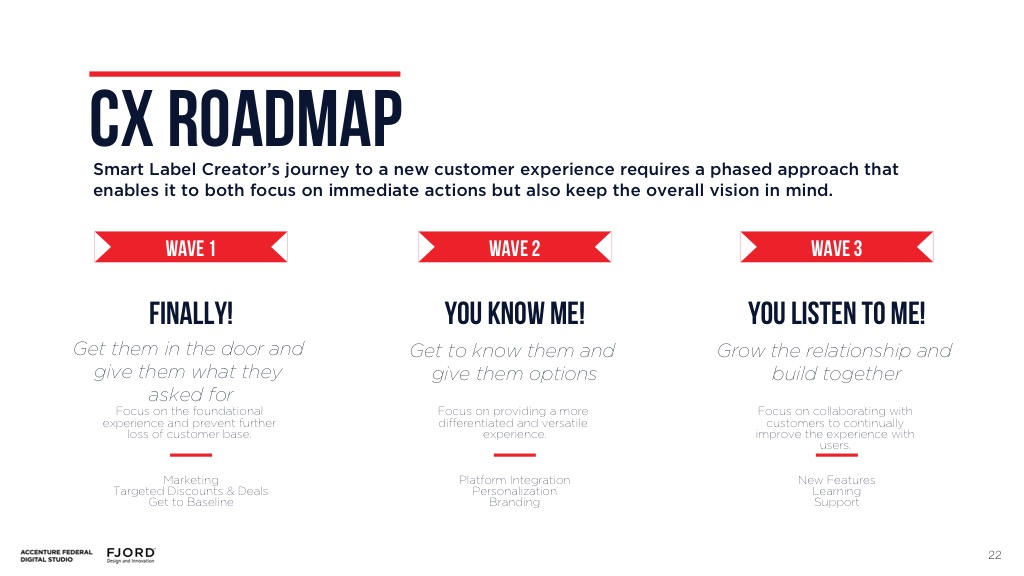
To conclude the project we completed a prioritization and roadmap of the innovation workshop concepts. The goal of this effort was to help the client better think through the business implications and requirements of each concept.
How might we reimagine the shipyard of the future?

Role: Experience & Exhibit Designer
Other Team Members: Service Design Lead, Visual Designers (x2), Business Designer, Data Analyst, Maritime Subject Matter Experts (2x)   

Our studio team was given an amazing ask: reimagine the shipyard of the future without constraints. We formed a small internal think-tank and tiger team to push the boundaries of technology and design to concept what future Maritime and shipyard experiences could become. We had a rapid ~8 week timeline to identify and bring our ideas to life.


We began the project with a rapid journey mapping exercise of the current state of a ship coming into dry-dock. Our client and subject matter experts provided us with a plethora of information to construct the initial journey map below and understand our users and the meta pain-points of docking a ship.

SOTF_Journey1.png

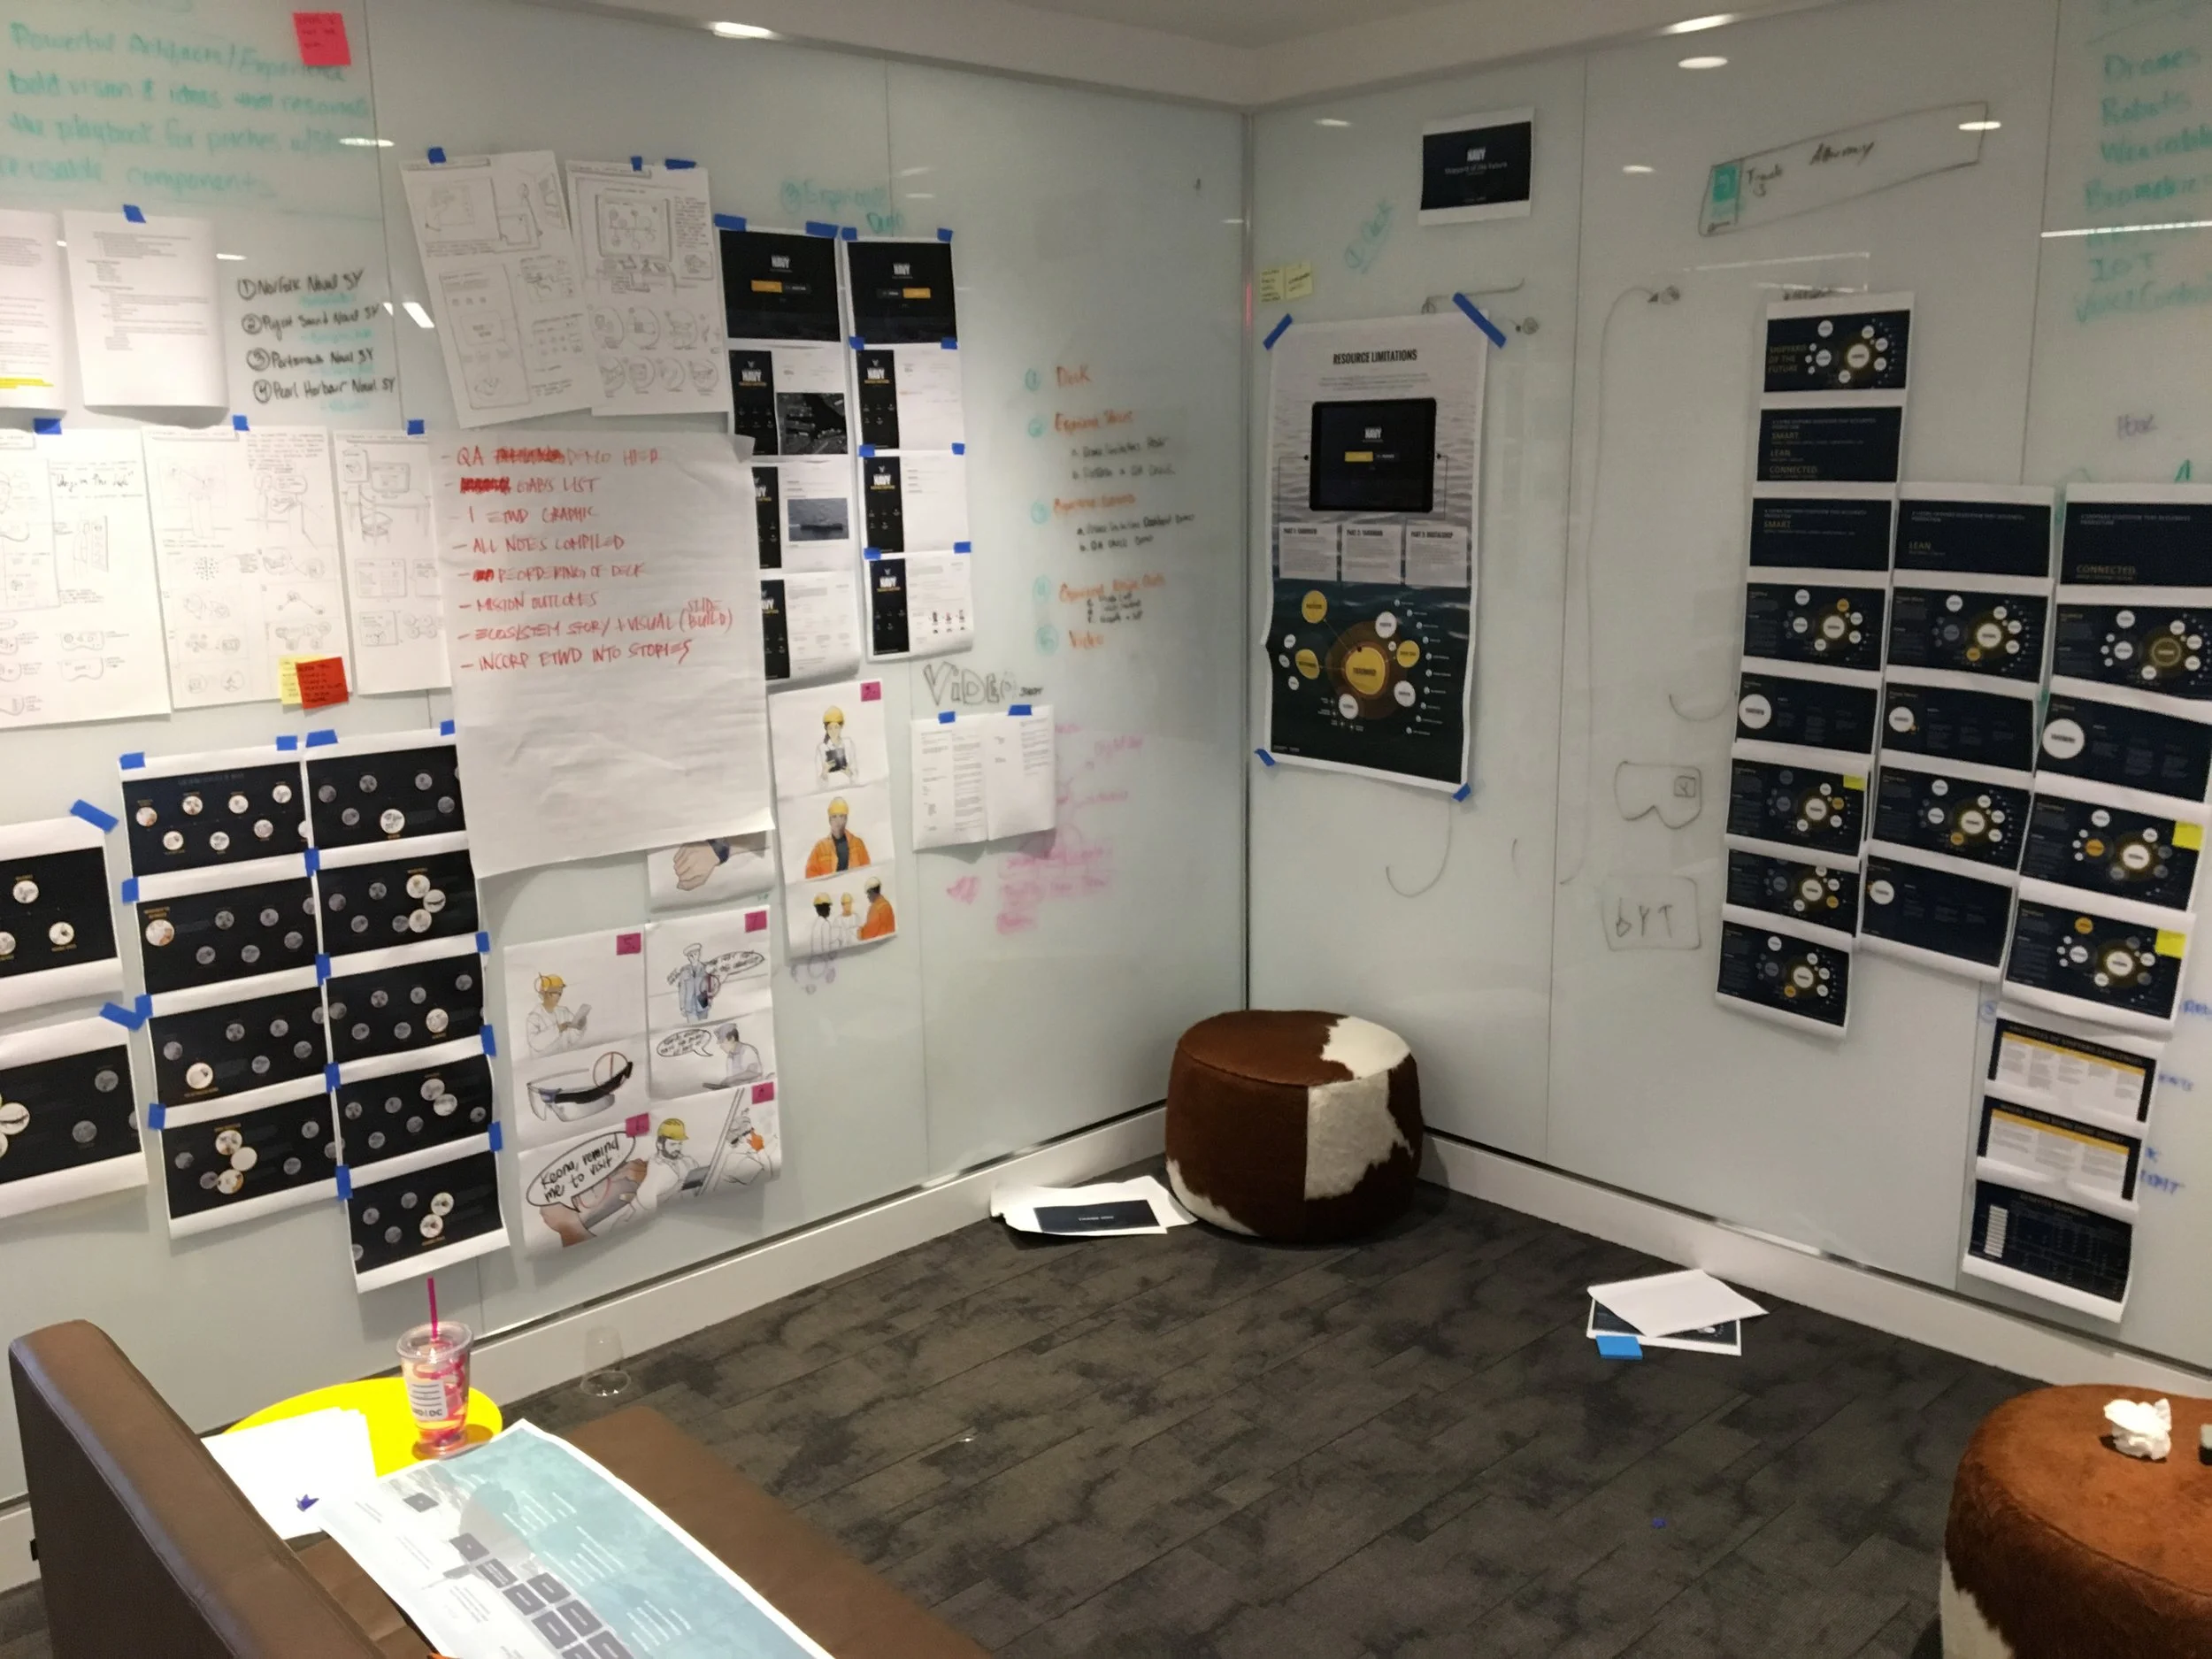
From our initial exploration we constructed an innovation focused workshop agenda and invited technologists and designers to come and innovate with our client and ourselves.


The workshop gave us a prioritized, in-depth list of concepts we could build from. To humanize, and bring our concepts to life we wrote detailed storylines that touched multiple roles and needs as well as highlighted the impact of our recommended technology (ex. Drones, AI). As we discussed our stories we recognized that all of our future concepts were connected by data. We then envisioned and constructed the data-driven ecosystem of the future: It allows individuals in each role to quickly make informed decisions and leverage digital tools to improve quality and workflow. The Shipyard of the Future will be smart, lean, and connected; ultimately increasing throughput and readiness.

Screen Shot 2018-05-18 at 4.35.56 PM.png

A brief description of our concepts are:

  • NautiCare is a predictive work plan tool that leverages multiple data sources and probability modeling to generate the first draft of the overall work plan with increased accuracy and a shortened lead time. To populate the work plan, Nauticare will pull historical data from YardMind, and SeaSense.

  • MasterMind is an integrated data environment with corresponding dashboards to enable the a fleet to make decisions surrounding throughput of shipyards. MasterMind works like the vantage point allowing leadership to decide when and how to best improve and repair their fleet.

  • YardMind is an integrated data engine and portal that supports ShipView, YardView, and Digital Shop and  allows personnel to easily access and capture information by ship, ship class, shop type, etc. per yard. YardMind acts as the heart of the shipyard as the hub of all shipyard data collection and knowledge, as well as the main output to the remaining three concepts. Each shipyard would have its own YardMind, and the collective view of the YardMinds is captured in MasterMind.

  • SeaSense is the management tool for the multiple sensor systems that are used before and during the dry-dock process on the ship and in the shipyard. SeaSense sensors or drones can be deployed prior to the ship coming into dock to collected data on the ships condition.

  • YardView is a dashboard for the entire shipyard, providing a real-time view of all ships, personnel, safety and environmental systems, and available capabilities.

  • Digital Shop is a system for each trade shop to monitor tasks, tools, and workers across the shipyard, supported by suite of apps that allows the foreman to customize based on shop needs and device usage.

  • ShipView is a platform for the ship that provides a real-time view of active work packages, personnel, systems, timeline, and more.


I took our stories and ecosystem and planned and illustrated how we could physically and digitally bring these stories to life with a series of concept exhibits. After reviewing with my team, I turned my original illustrations into “recipe cards” that detailed what, why, and how we were going to build out the exhibits. (Note* Not all exhibits are shown)

The team then built out 6 physical and digital exhibits across a variety of mediums. I did a review of the available technology in our studio and them maximized our existing tech and build capabilities for our demos. We held a presentation and exhibit meeting and presented these demos to our client in our workshop room:

Sample of Our Demos:

The original demos were a huge success with our client. So much so, that our client asked us to make our demo’s portable so they could take them on a roadshow around the world. I worked with members of the original team to rethink how we could transform these demos to 1. Fit into a suitcase and 2. Set up and collapse easily. We redesigned all but one of the demos to fit into a neat microsite that could be viewed from an iPad pro. We then selected one demo: “Execute a Work Package” to be more interactive by designing an interactive powerpoint on a smartphone to be viewed via google cardboard.


DATA & DESIGN: Developing interwoven processes to harness the power of data in design work.

As designers and researchers in the digital environment we are constantly being asked to consider data in our design work. Our key question has become: How do we successfully incorporate the right data in the right ways so that users are empowered to make smarter and more insightful decisions, while not being overwhelmed by additional information or material?

I have worked on several projects that have incorporated work streams of both data and design. I wish to highlight two methodologies that I helped create within our studio:

  1. Customer segmentation data + design research

  2. Fjord DC Studio’s data storytelling process and templates


Customer Segmentation Data + Design Research

Role: Experience Designer & Researcher
Other Team Members: Service Designer Lead, Business Design Lead, Visual Designer

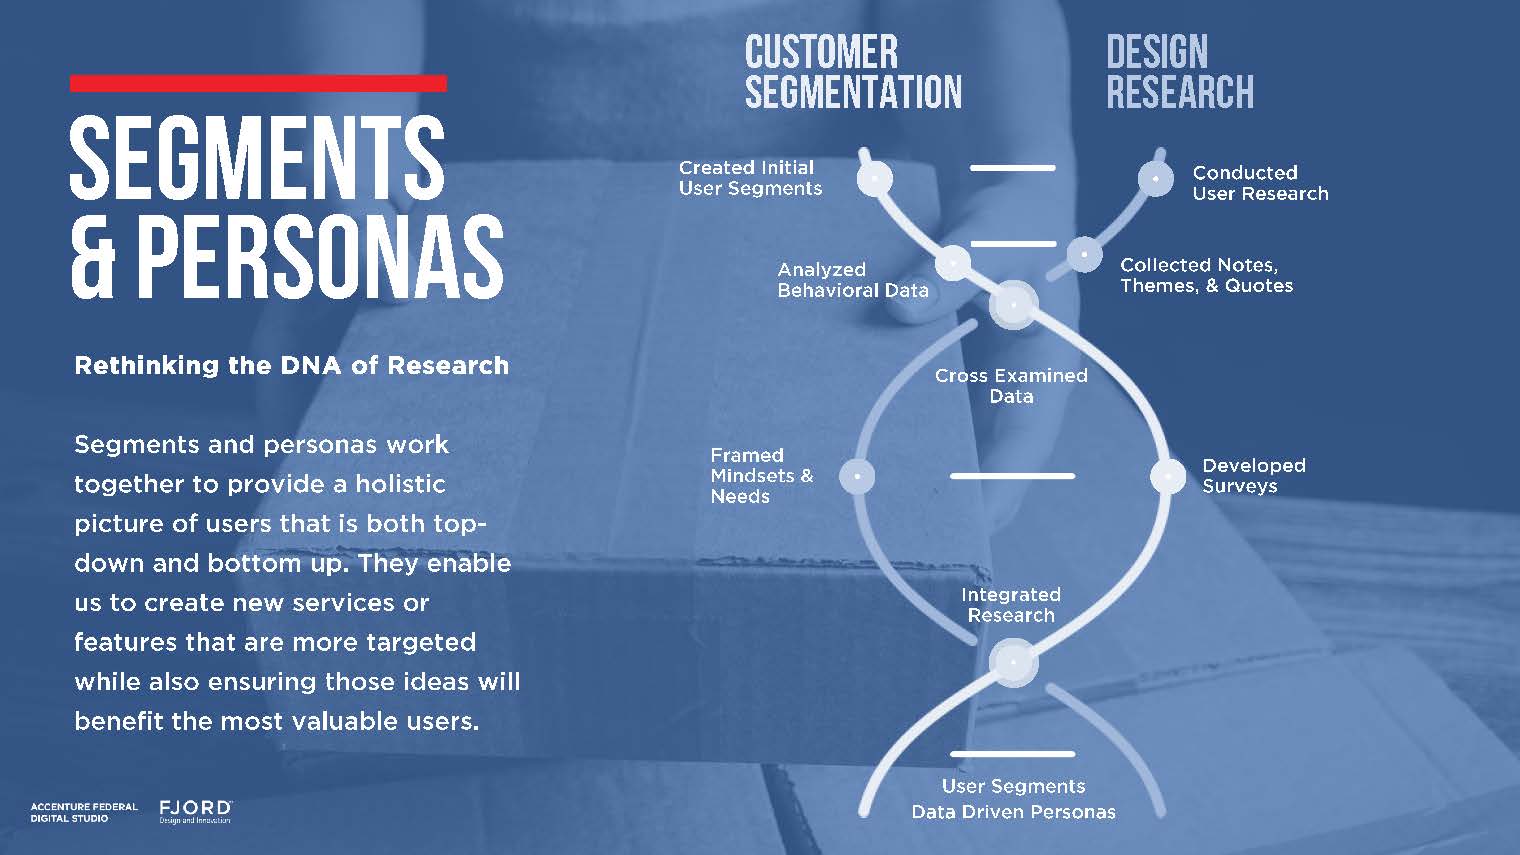
Our team was asked to conduct a multidisciplinary research project for a large national shipping service to derive insights from a customer segmentation, market research, and user and stakeholder interviews. Rather that run the research streams separately our research became woven - and at points in which our research interlaced the data, market, and user findings created opportunities for conversation between the separate project channels that became points to pivot or iterate. I wrote and illustrated the initial DNA approach to our process, which was developed and improved by my team. A sample overview of process is below:

Segmentation&DesignApproach.jpg

Data Storytelling

Role: Experience/ Interaction Designer
Other Team Members: Service Designer, Data Designers (2x), Development Team, Visual Designer.

As part of a client pitch the design team was asked to incorporate open-source client data in a meaningful way. Online research revealed that our client’s department had mixed public perceptions ranging from good to very bad. We decided to combine the narrative strength of storytelling with the insightful nature of data to construct a public facing data-story that would illuminate the true nature of our client’s department.

First, to explain the process and benefits of combining data and storytelling to our clients I researched, wrote, and illustrated the following slides:

I worked closely with the service designer to create the following template. It is based off of a classic narrative arch structure, but we realized that data needed to be arranged as a series of revealing insights that build on one another, rather than as a narrative flow.

Slide16.jpeg

Then we researched and constructed a process and series of templates to brainstorm and build data stories with our client. We held a workshop with our client and co-created data stories with them.

At the workshop we also presented high fidelity data stories and visualizations that we built with the data designer and development team. You can interact with the designs here. 


Finally, the service designer and I worked to turn this work into a teachable methodology. We presented the process and templates in a workshop we gave at the 2017 Fjord global learning summit (called Fjord Equinox) and empowered other Fjordians to become data-storytellers.

presenting.png


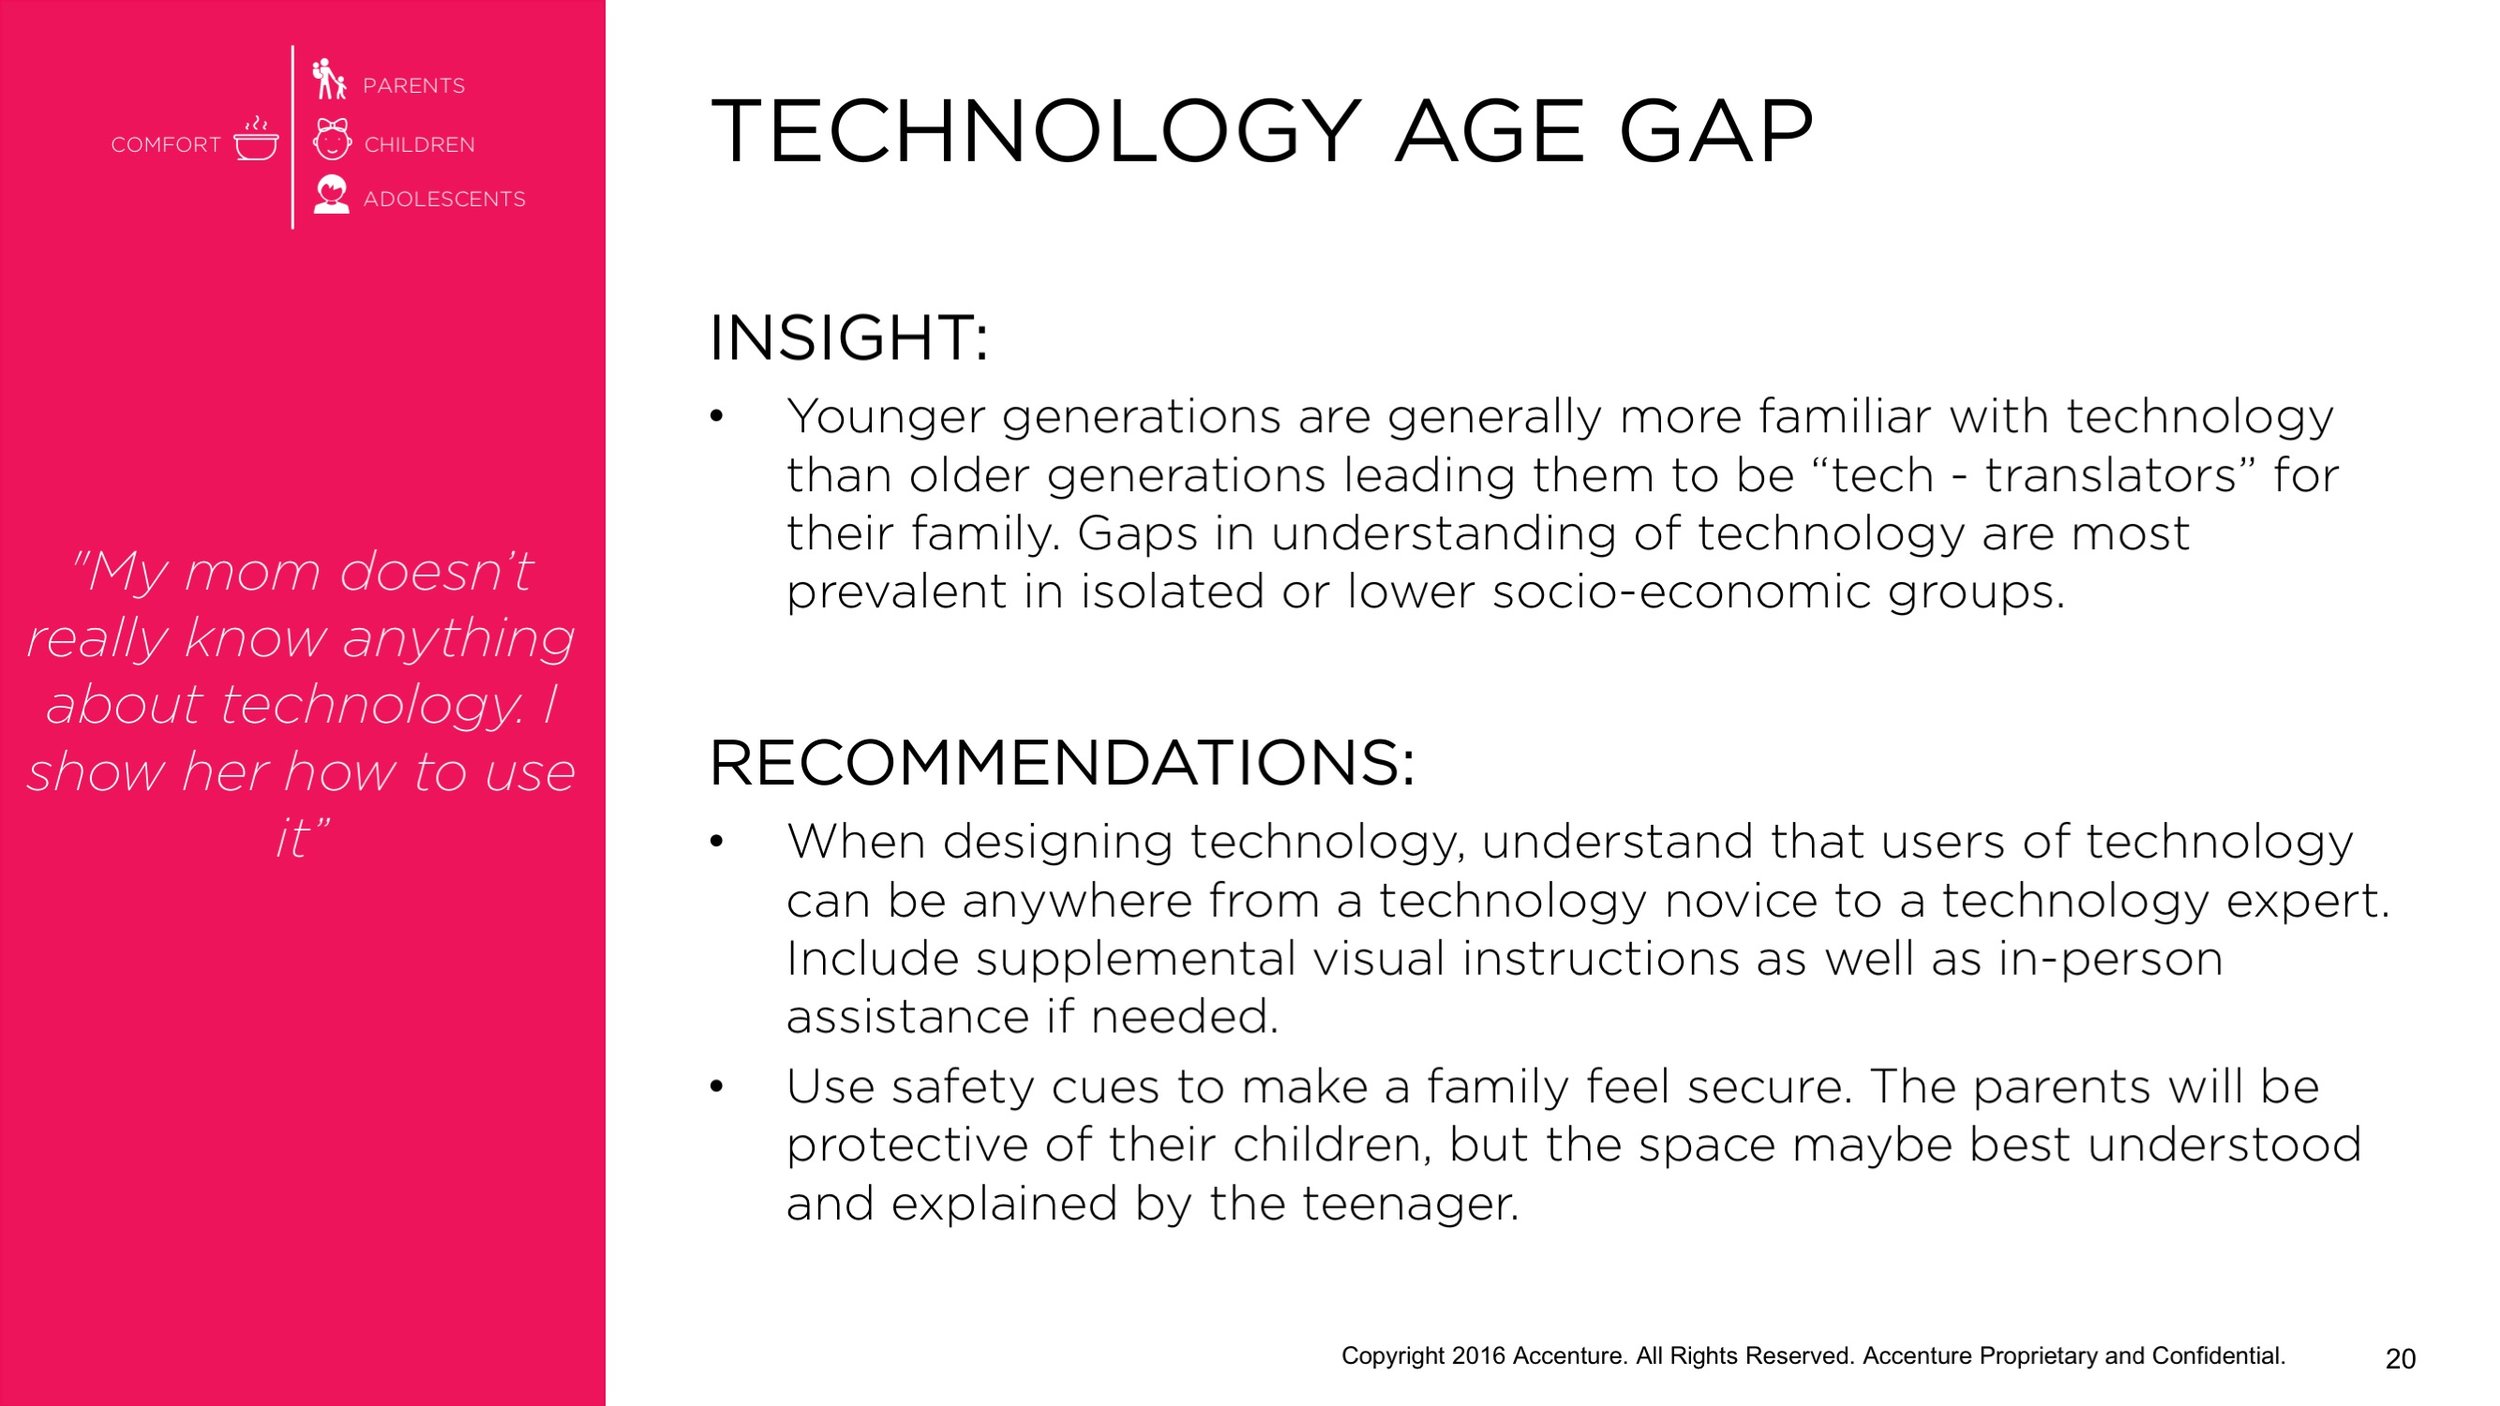
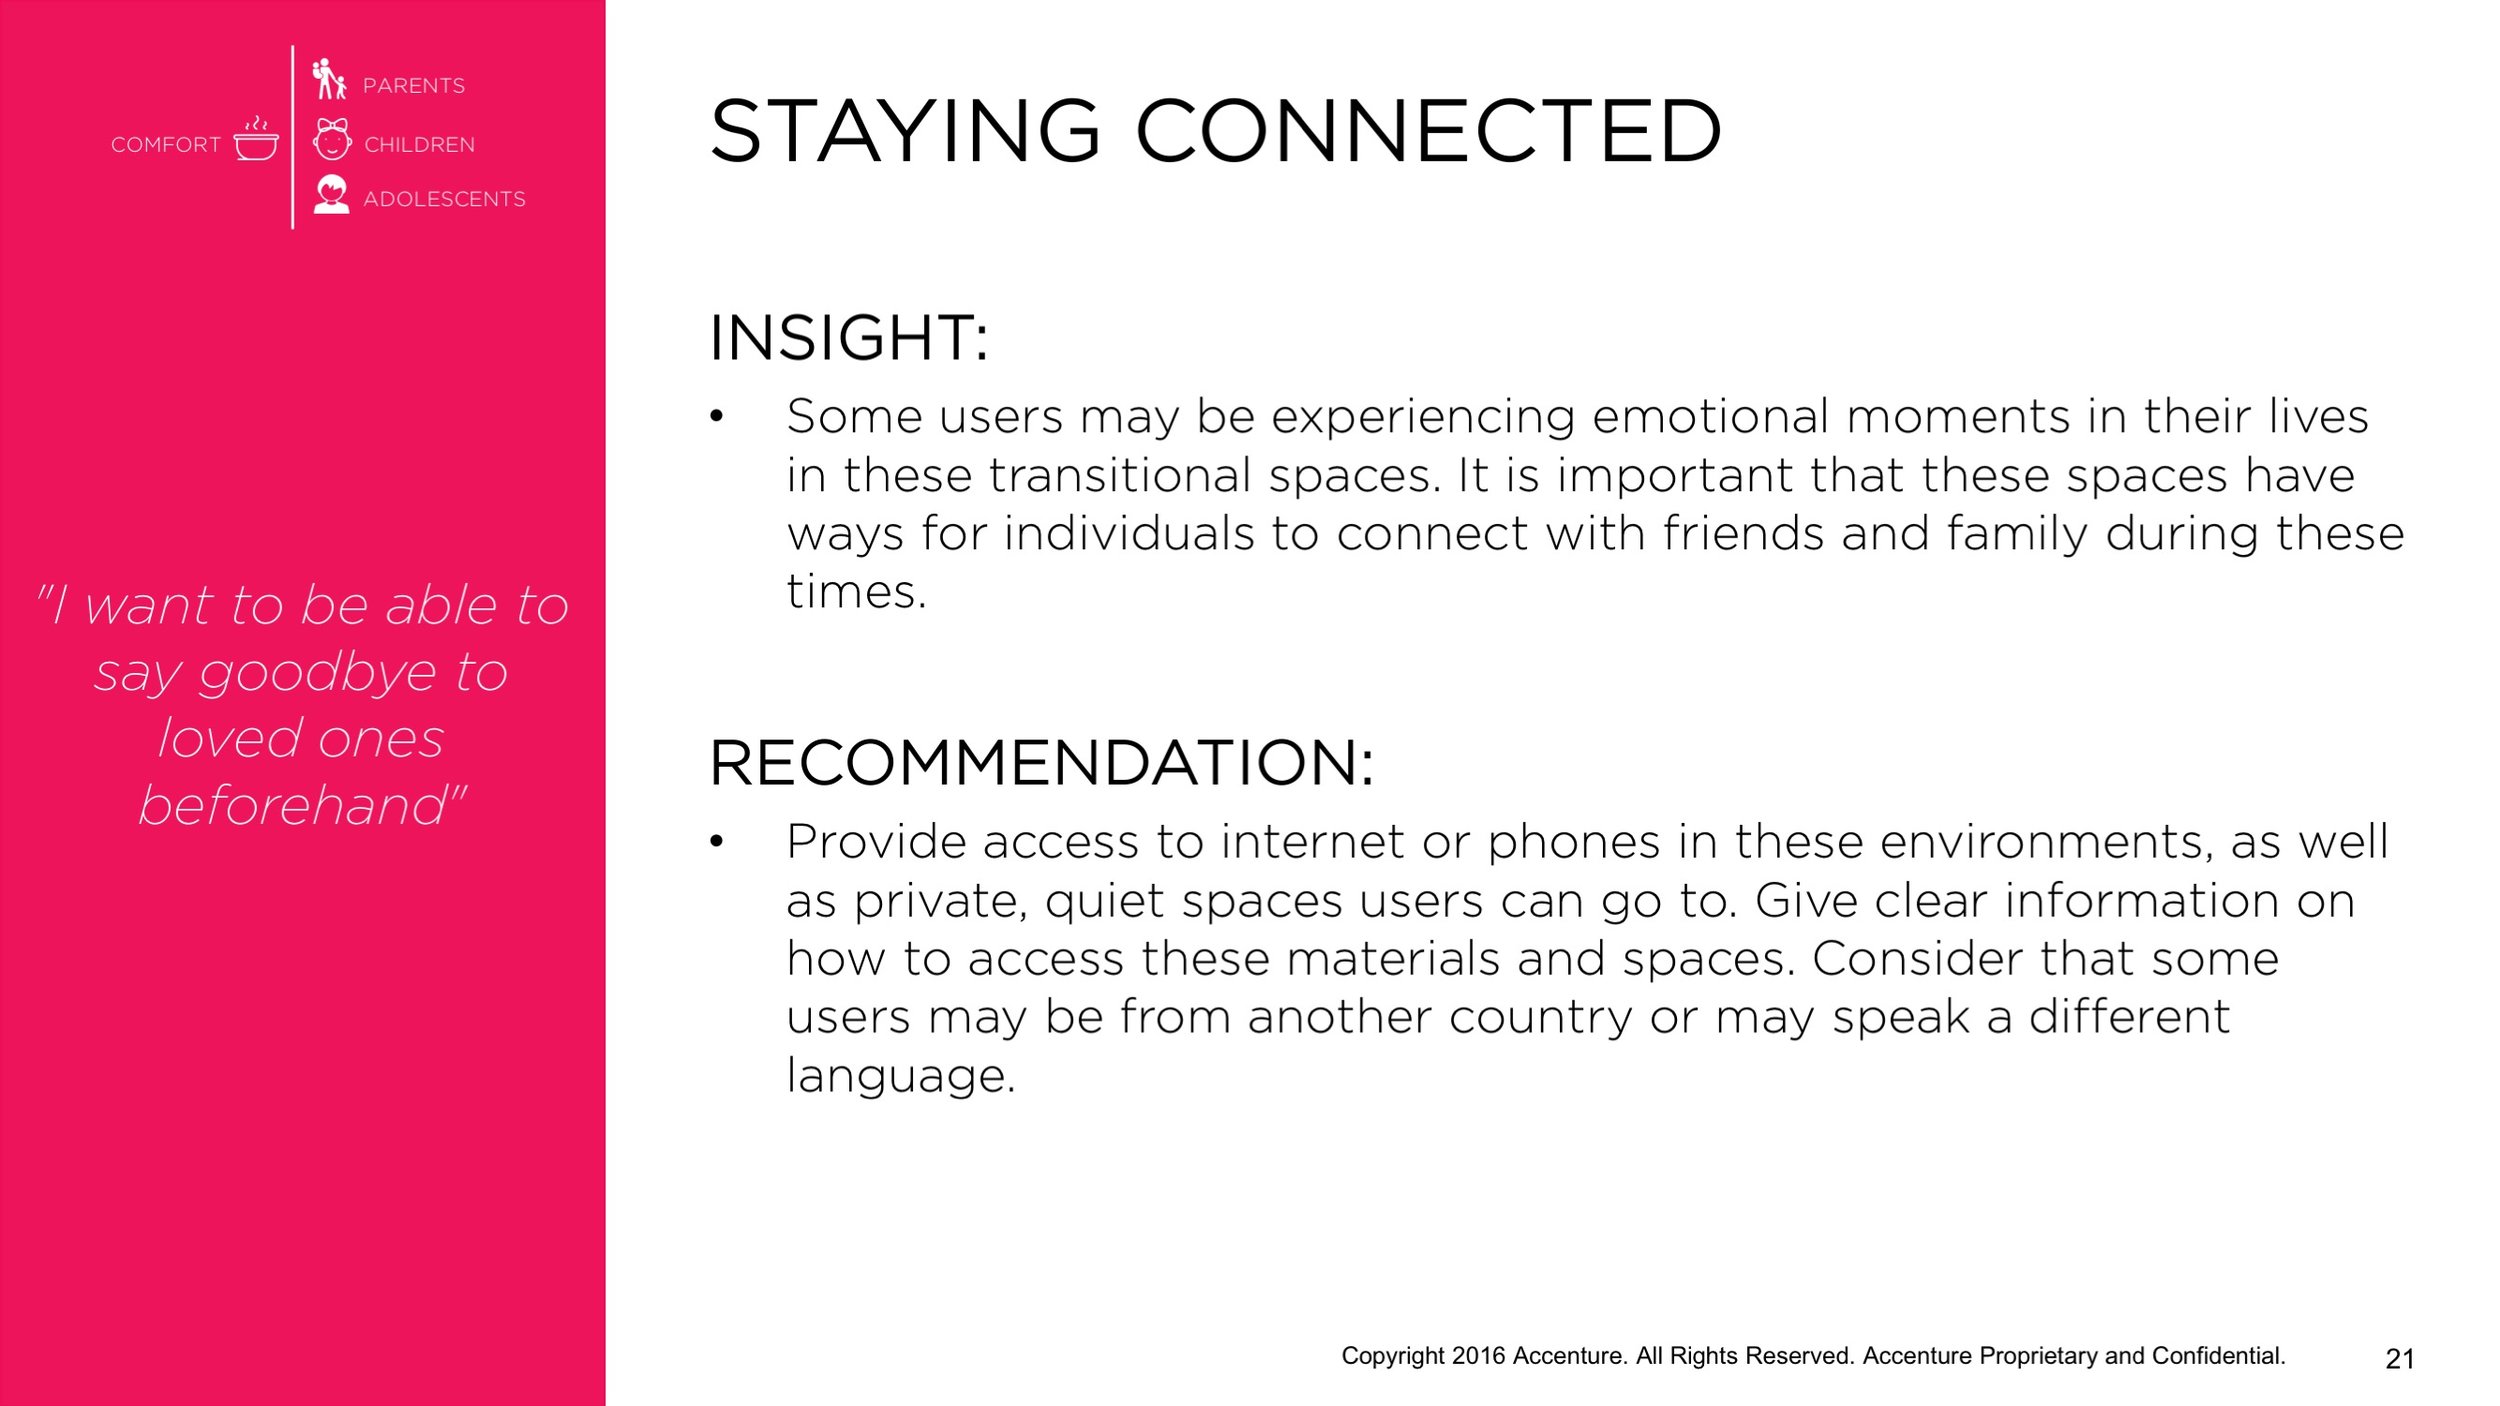
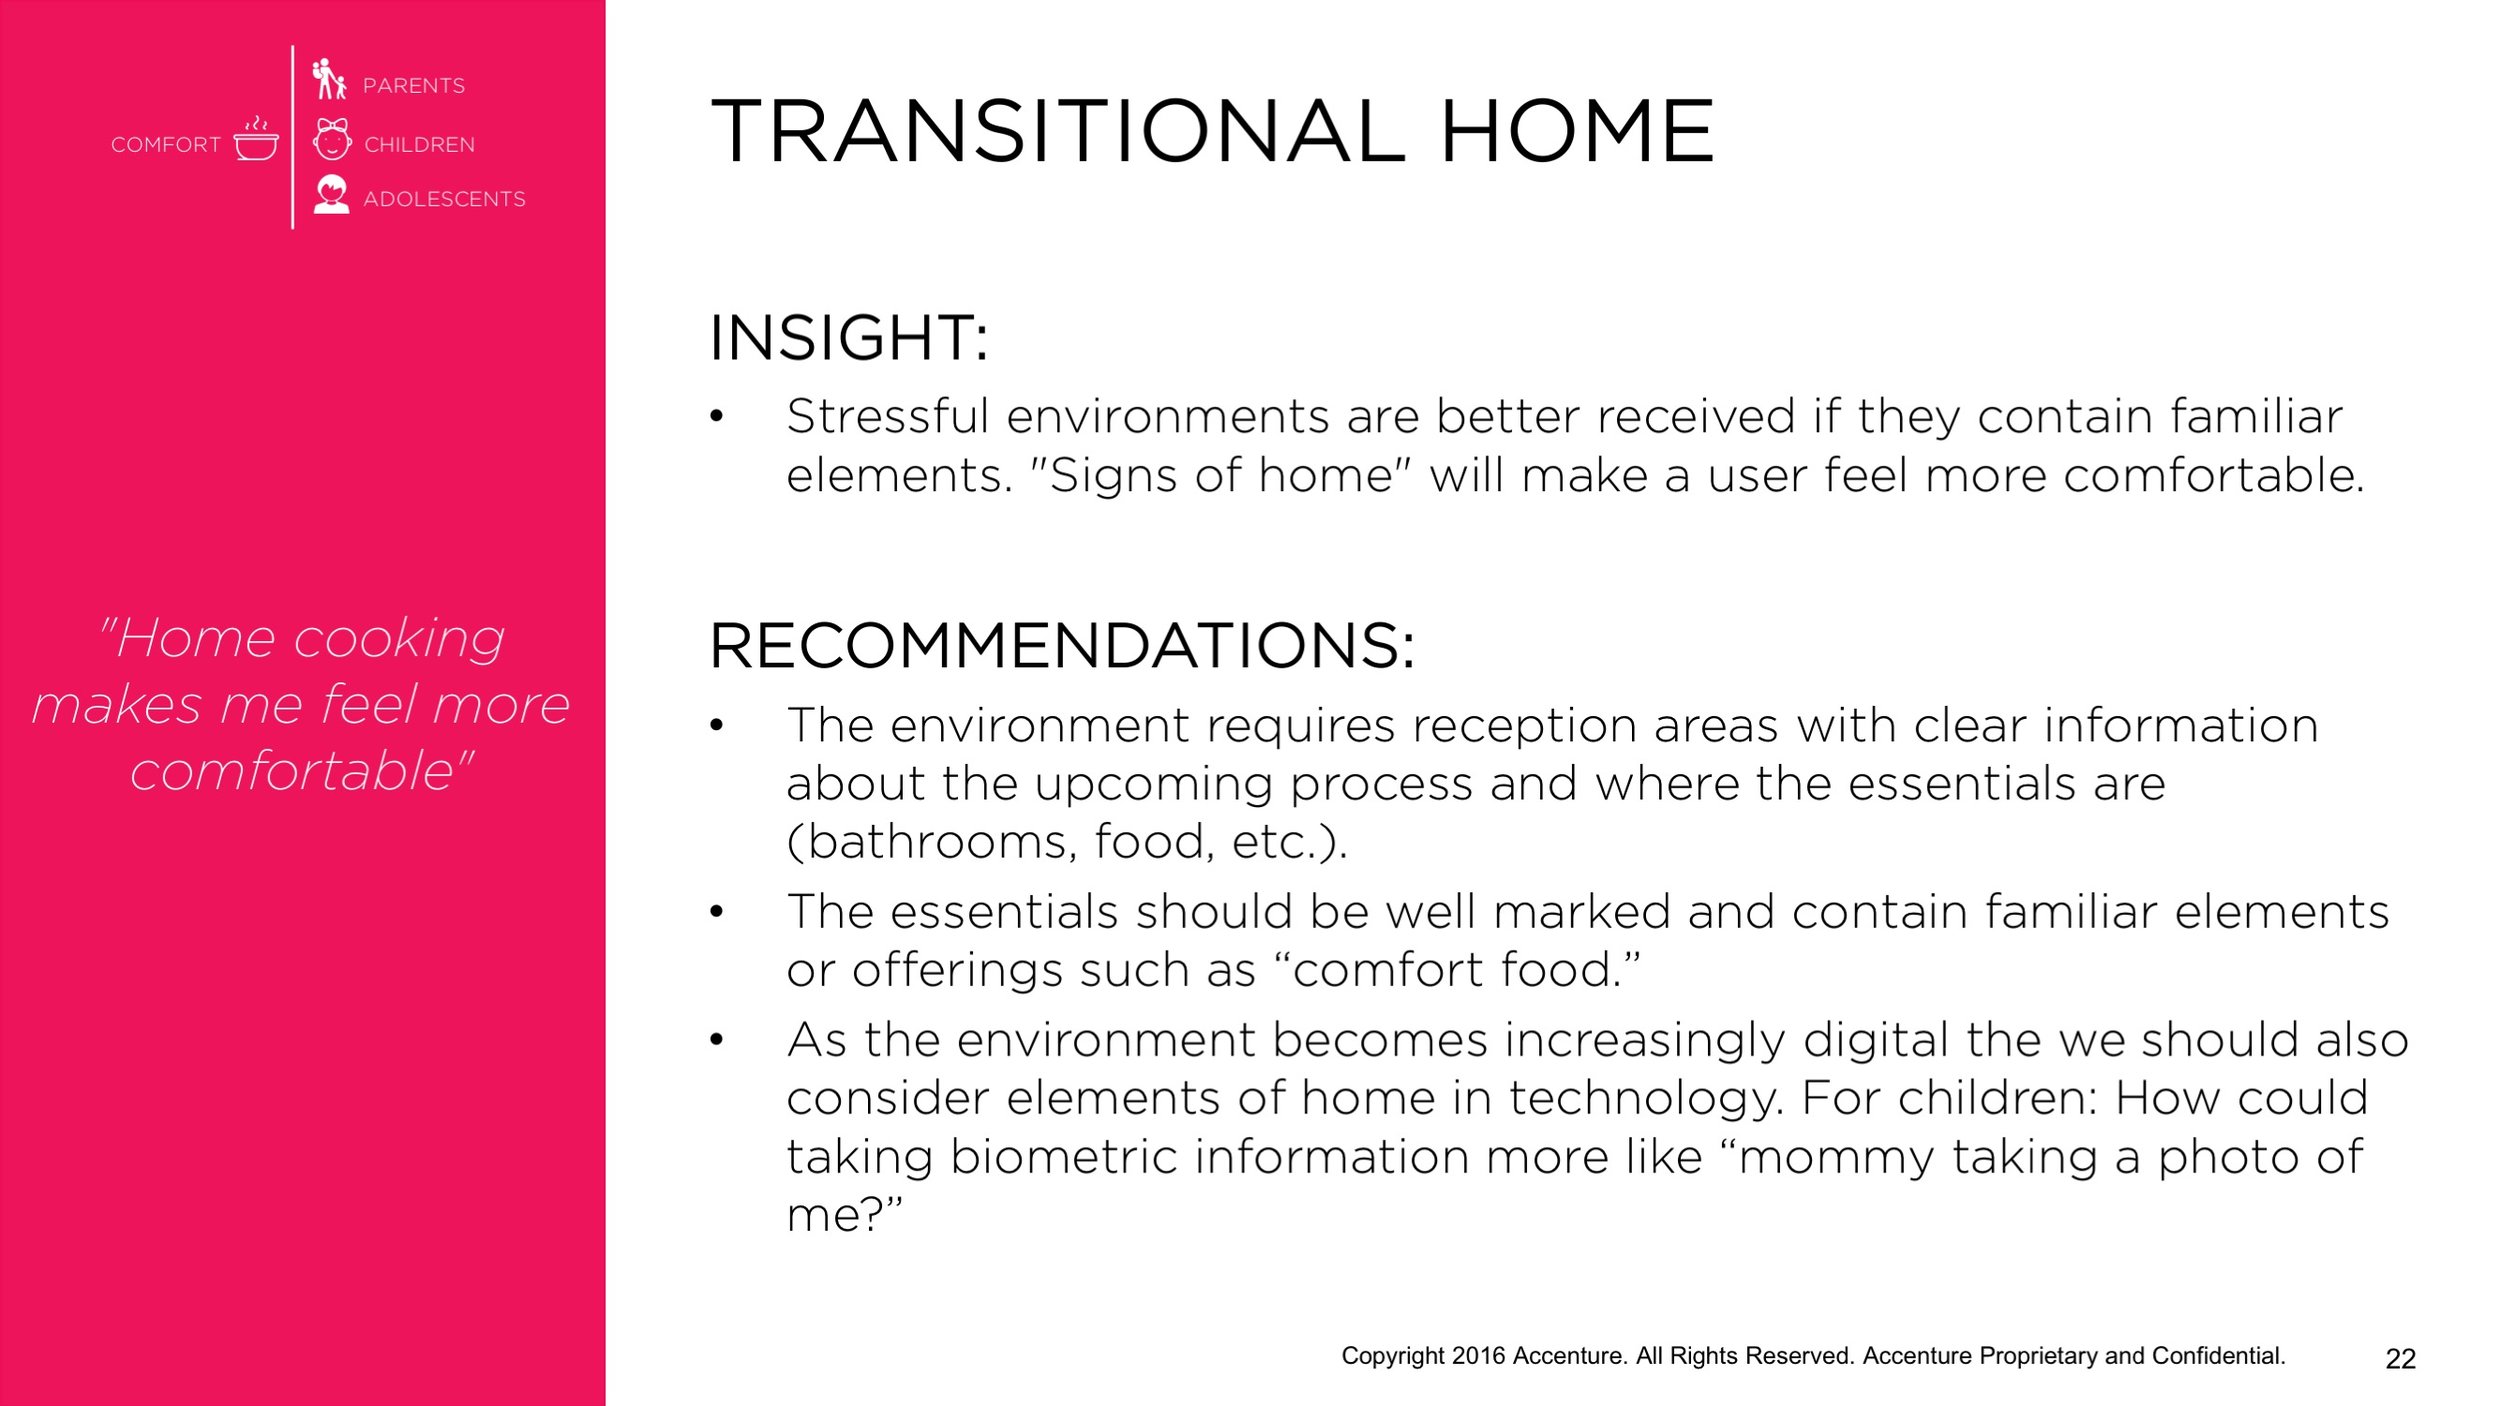
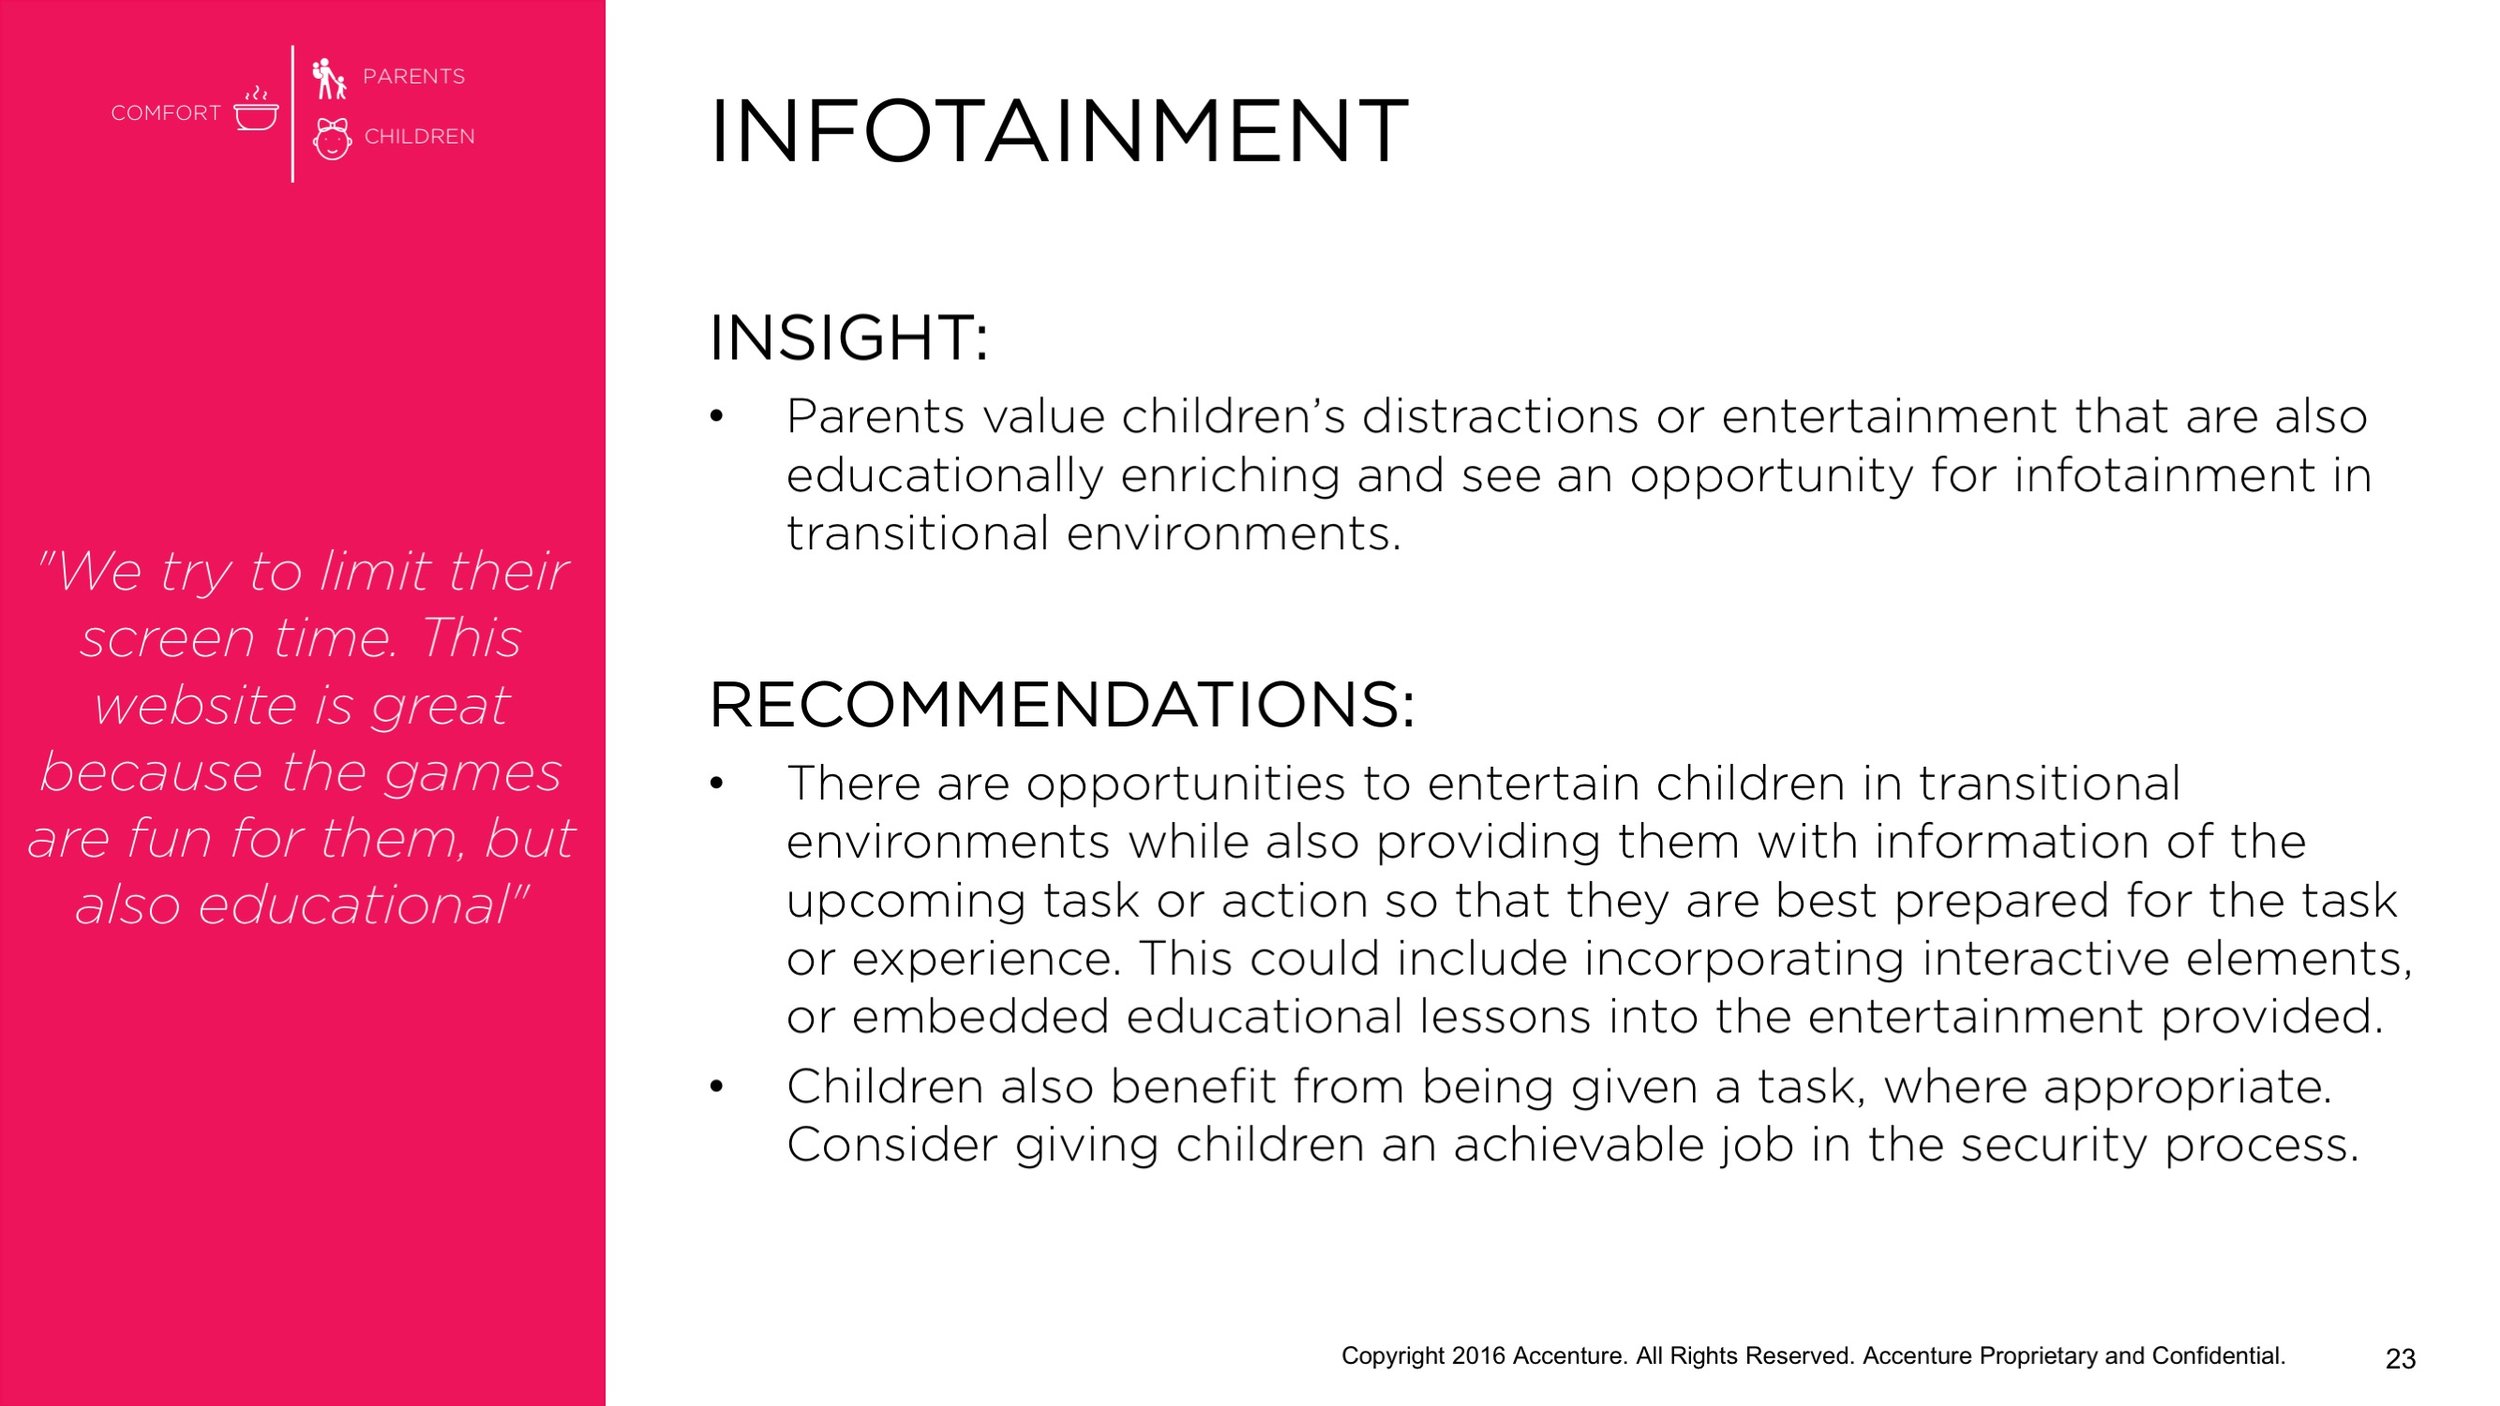
How might we investigate children’s and parent’s needs and feelings of safety and identity in transitional environments?

Role: Lead Research & Designer
Other Team-Members: Producer, Intern 

Summary image.jpg

This was a Fjord Makeshop project. The Makeshop is Fjord’s “proprietary build-to-think process that allows us to explore ideas and build design solutions in fresh ways. After all, the only way to see if a design or product works is to make it. And that’s exactly what we do, using technology as an enabler and starting point for great design.” -  Fjordnet.com

When we design for federal needs and services our default users are almost always adults - however young adults and children are often involved in federal services, programs, and locations in a variety of ways. In this research study and concept project we explored children and parent’s:

  • Feelings towards cultural, racial, and family identity

  • Feelings of giving personal information or data (Consent)

  • Feelings towards environmental machinery or technology

  • Feelings towards procedural processes and flow of people

  • Feelings towards reception and waiting

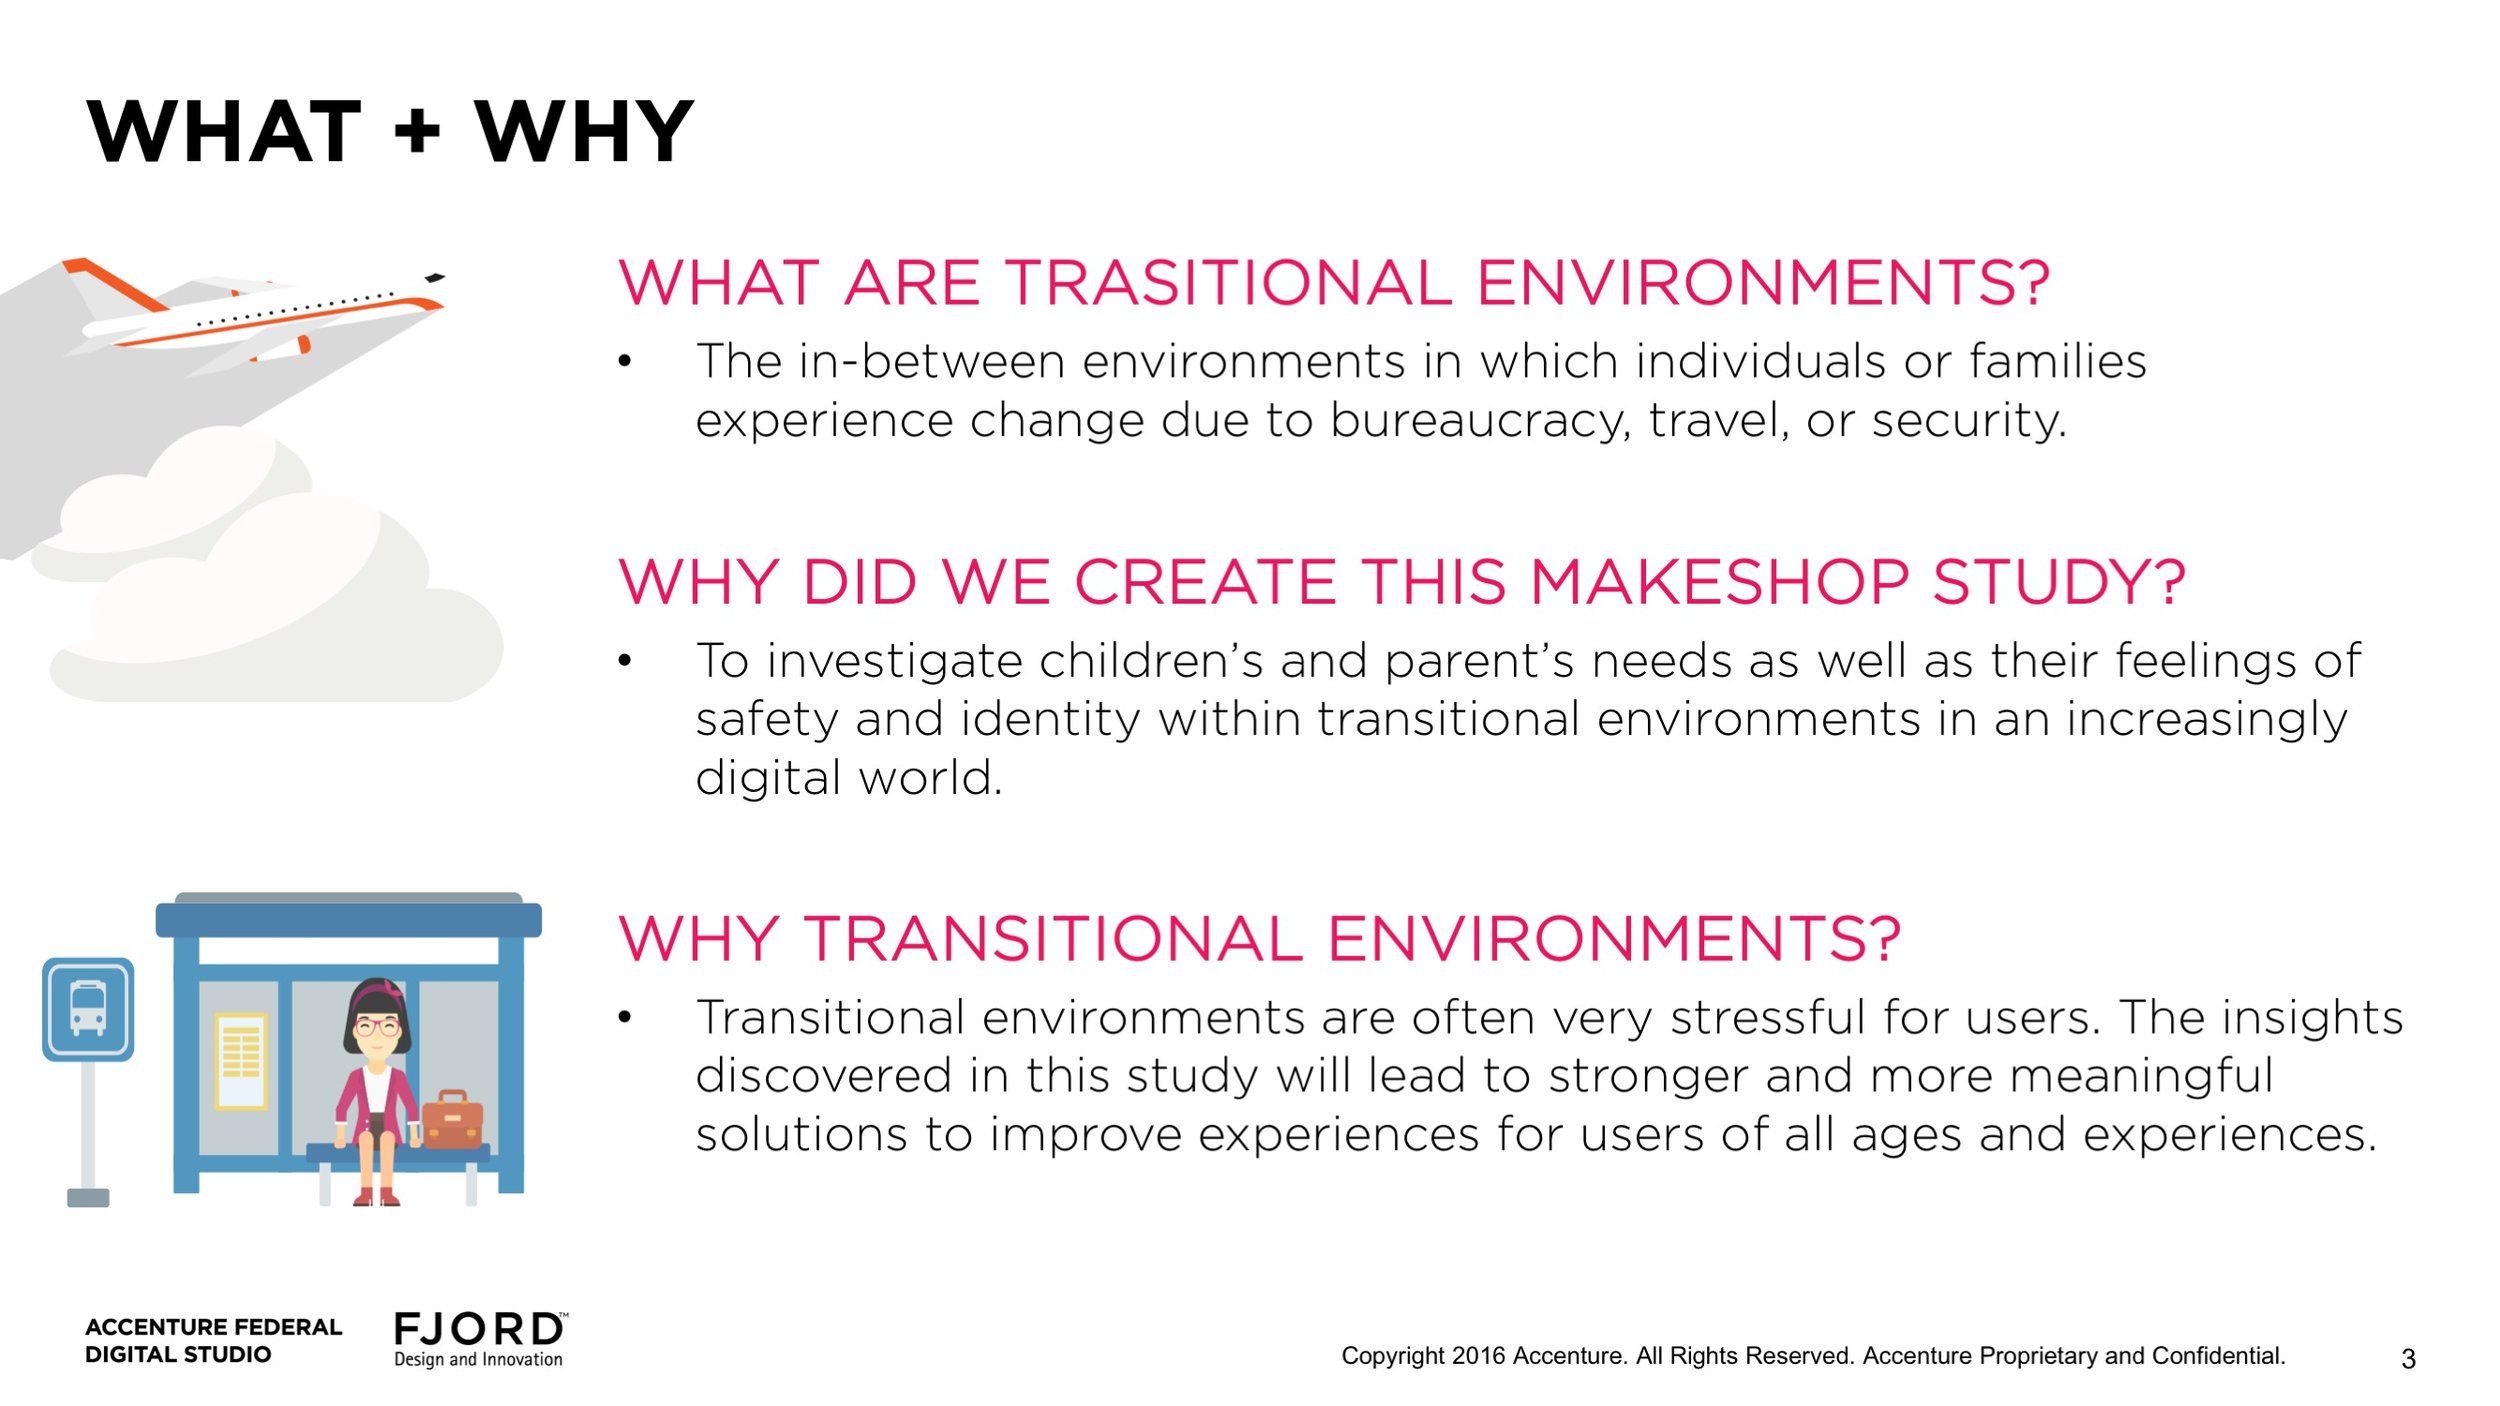
How did we define Transitional Environments: The in-between environments in which individuals or families’ experience change due to bureaucracy, travel, or security. For example: airports, country borders, hotel receptions, school & universities, train stations, and hospital receptions. In the future: automated car or train services, and more.


Creative Interviews with Children, Young Adults, and Parents:

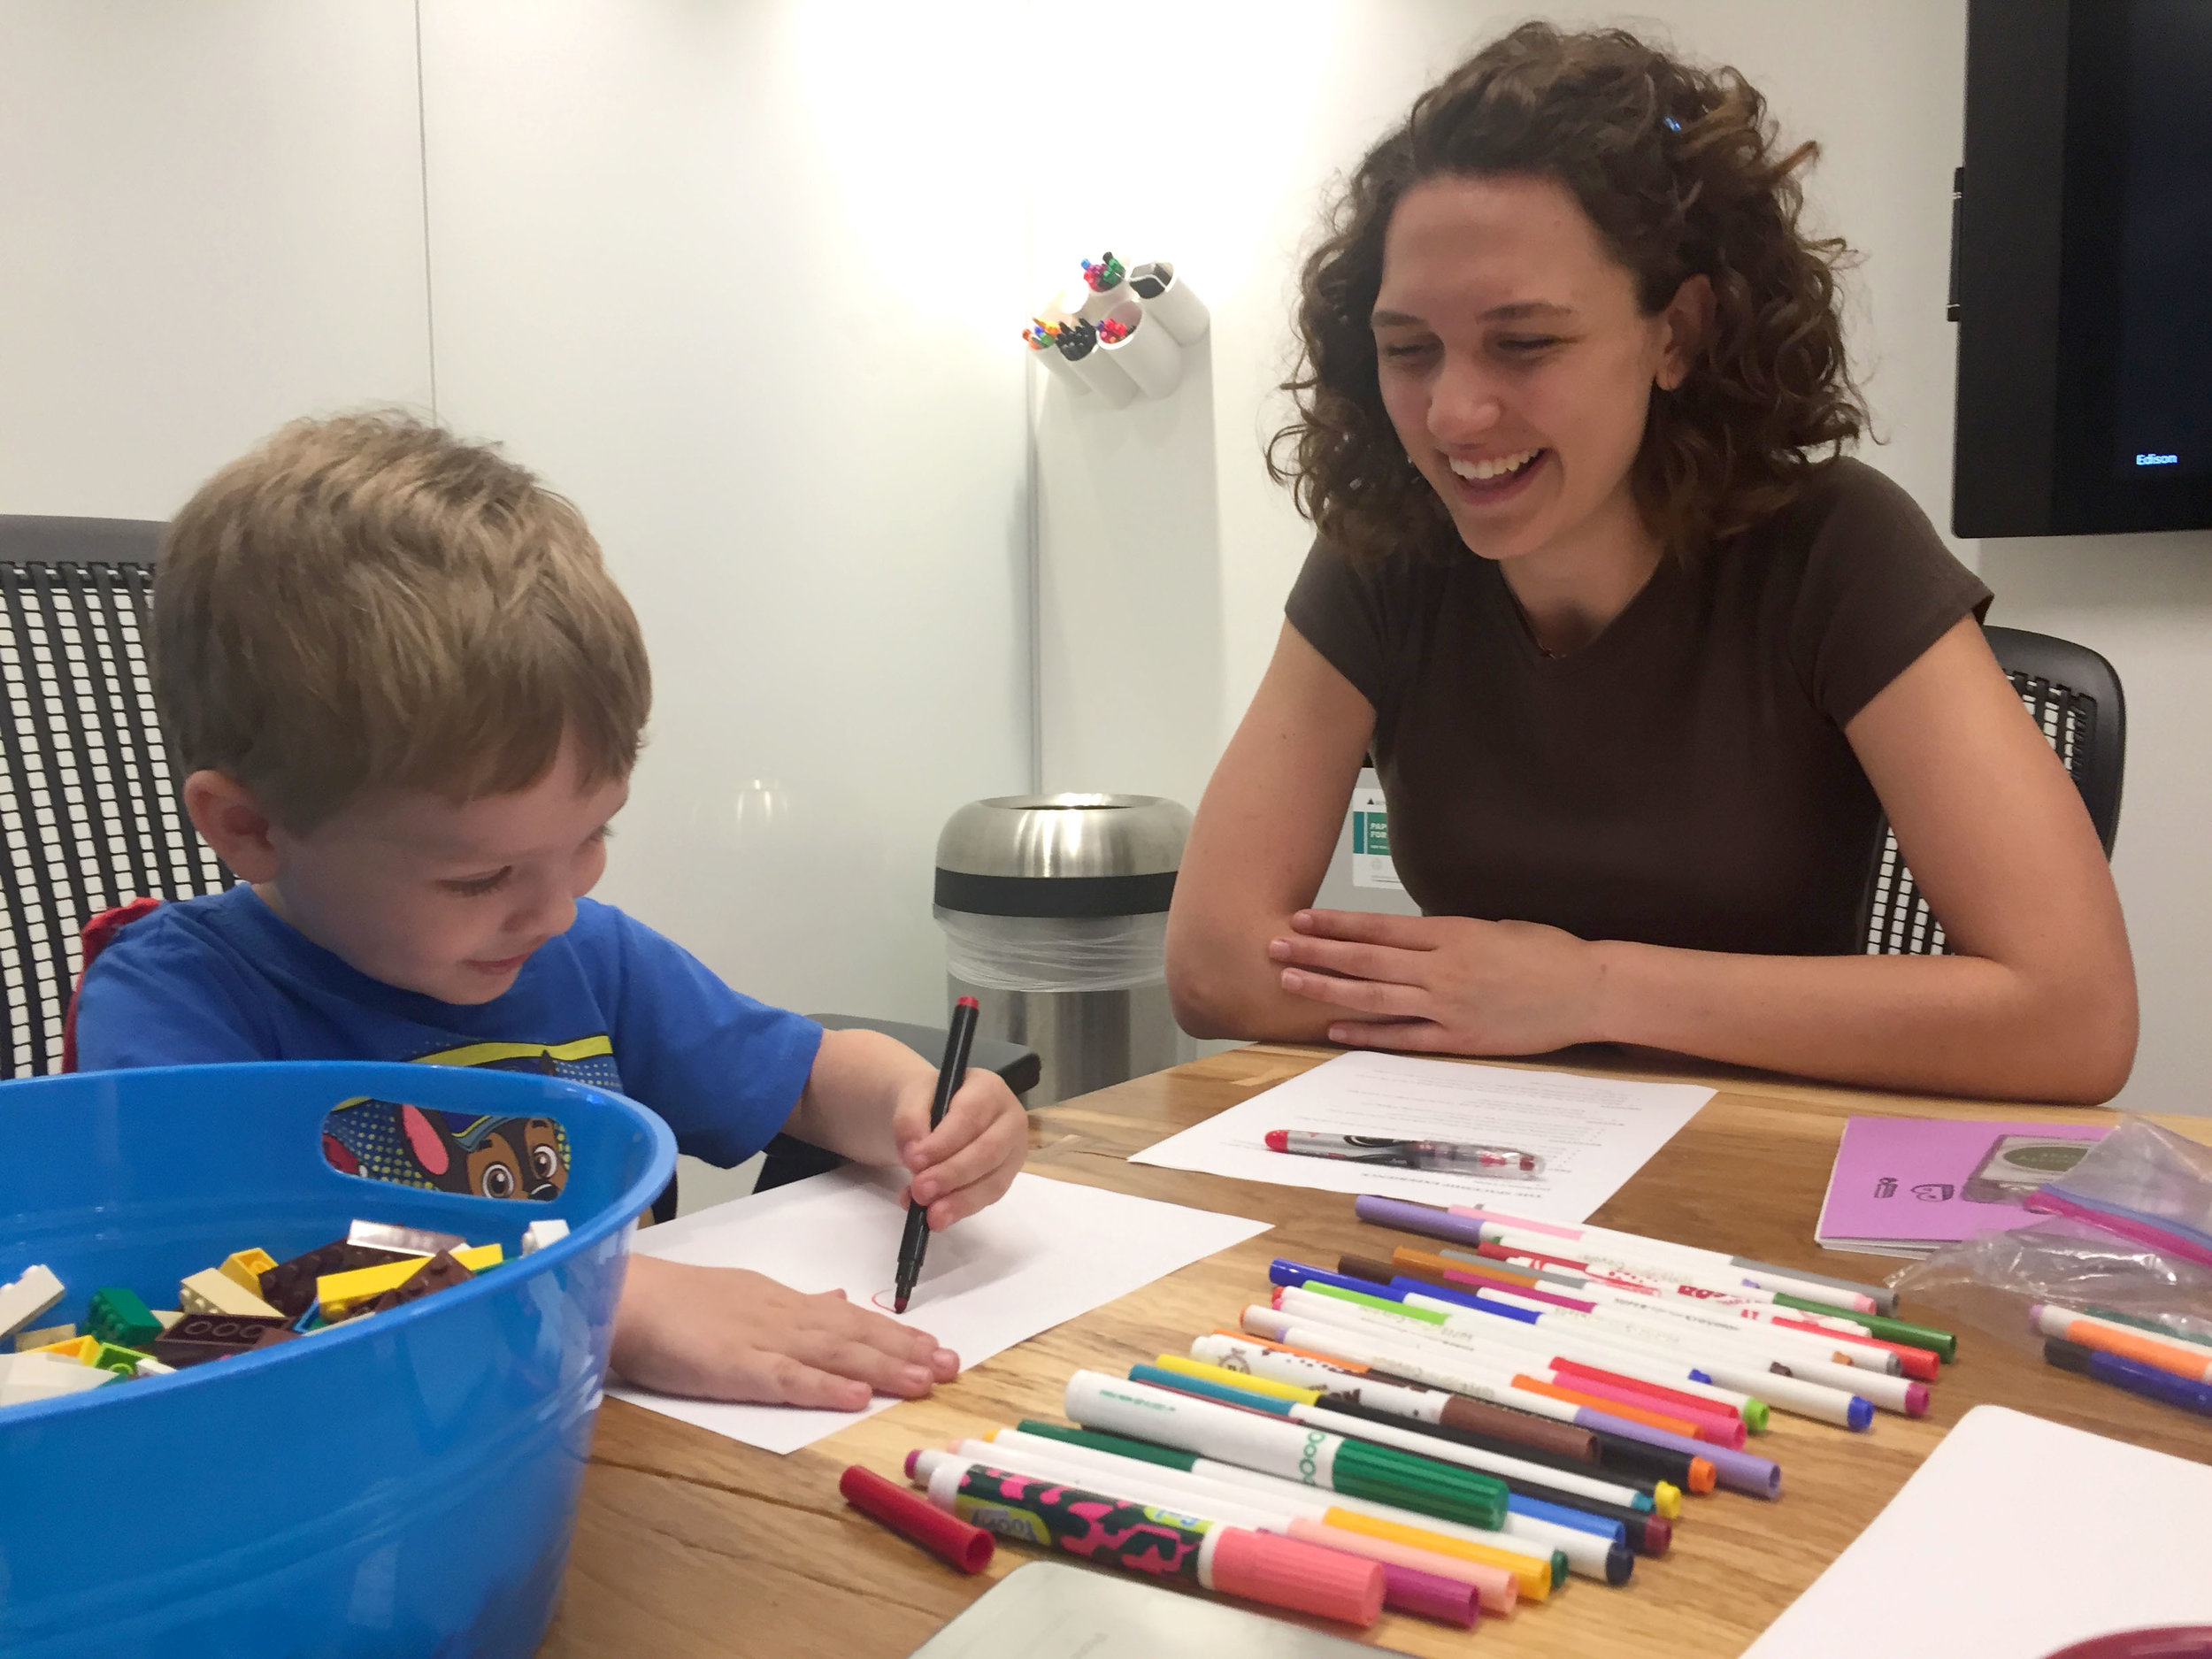
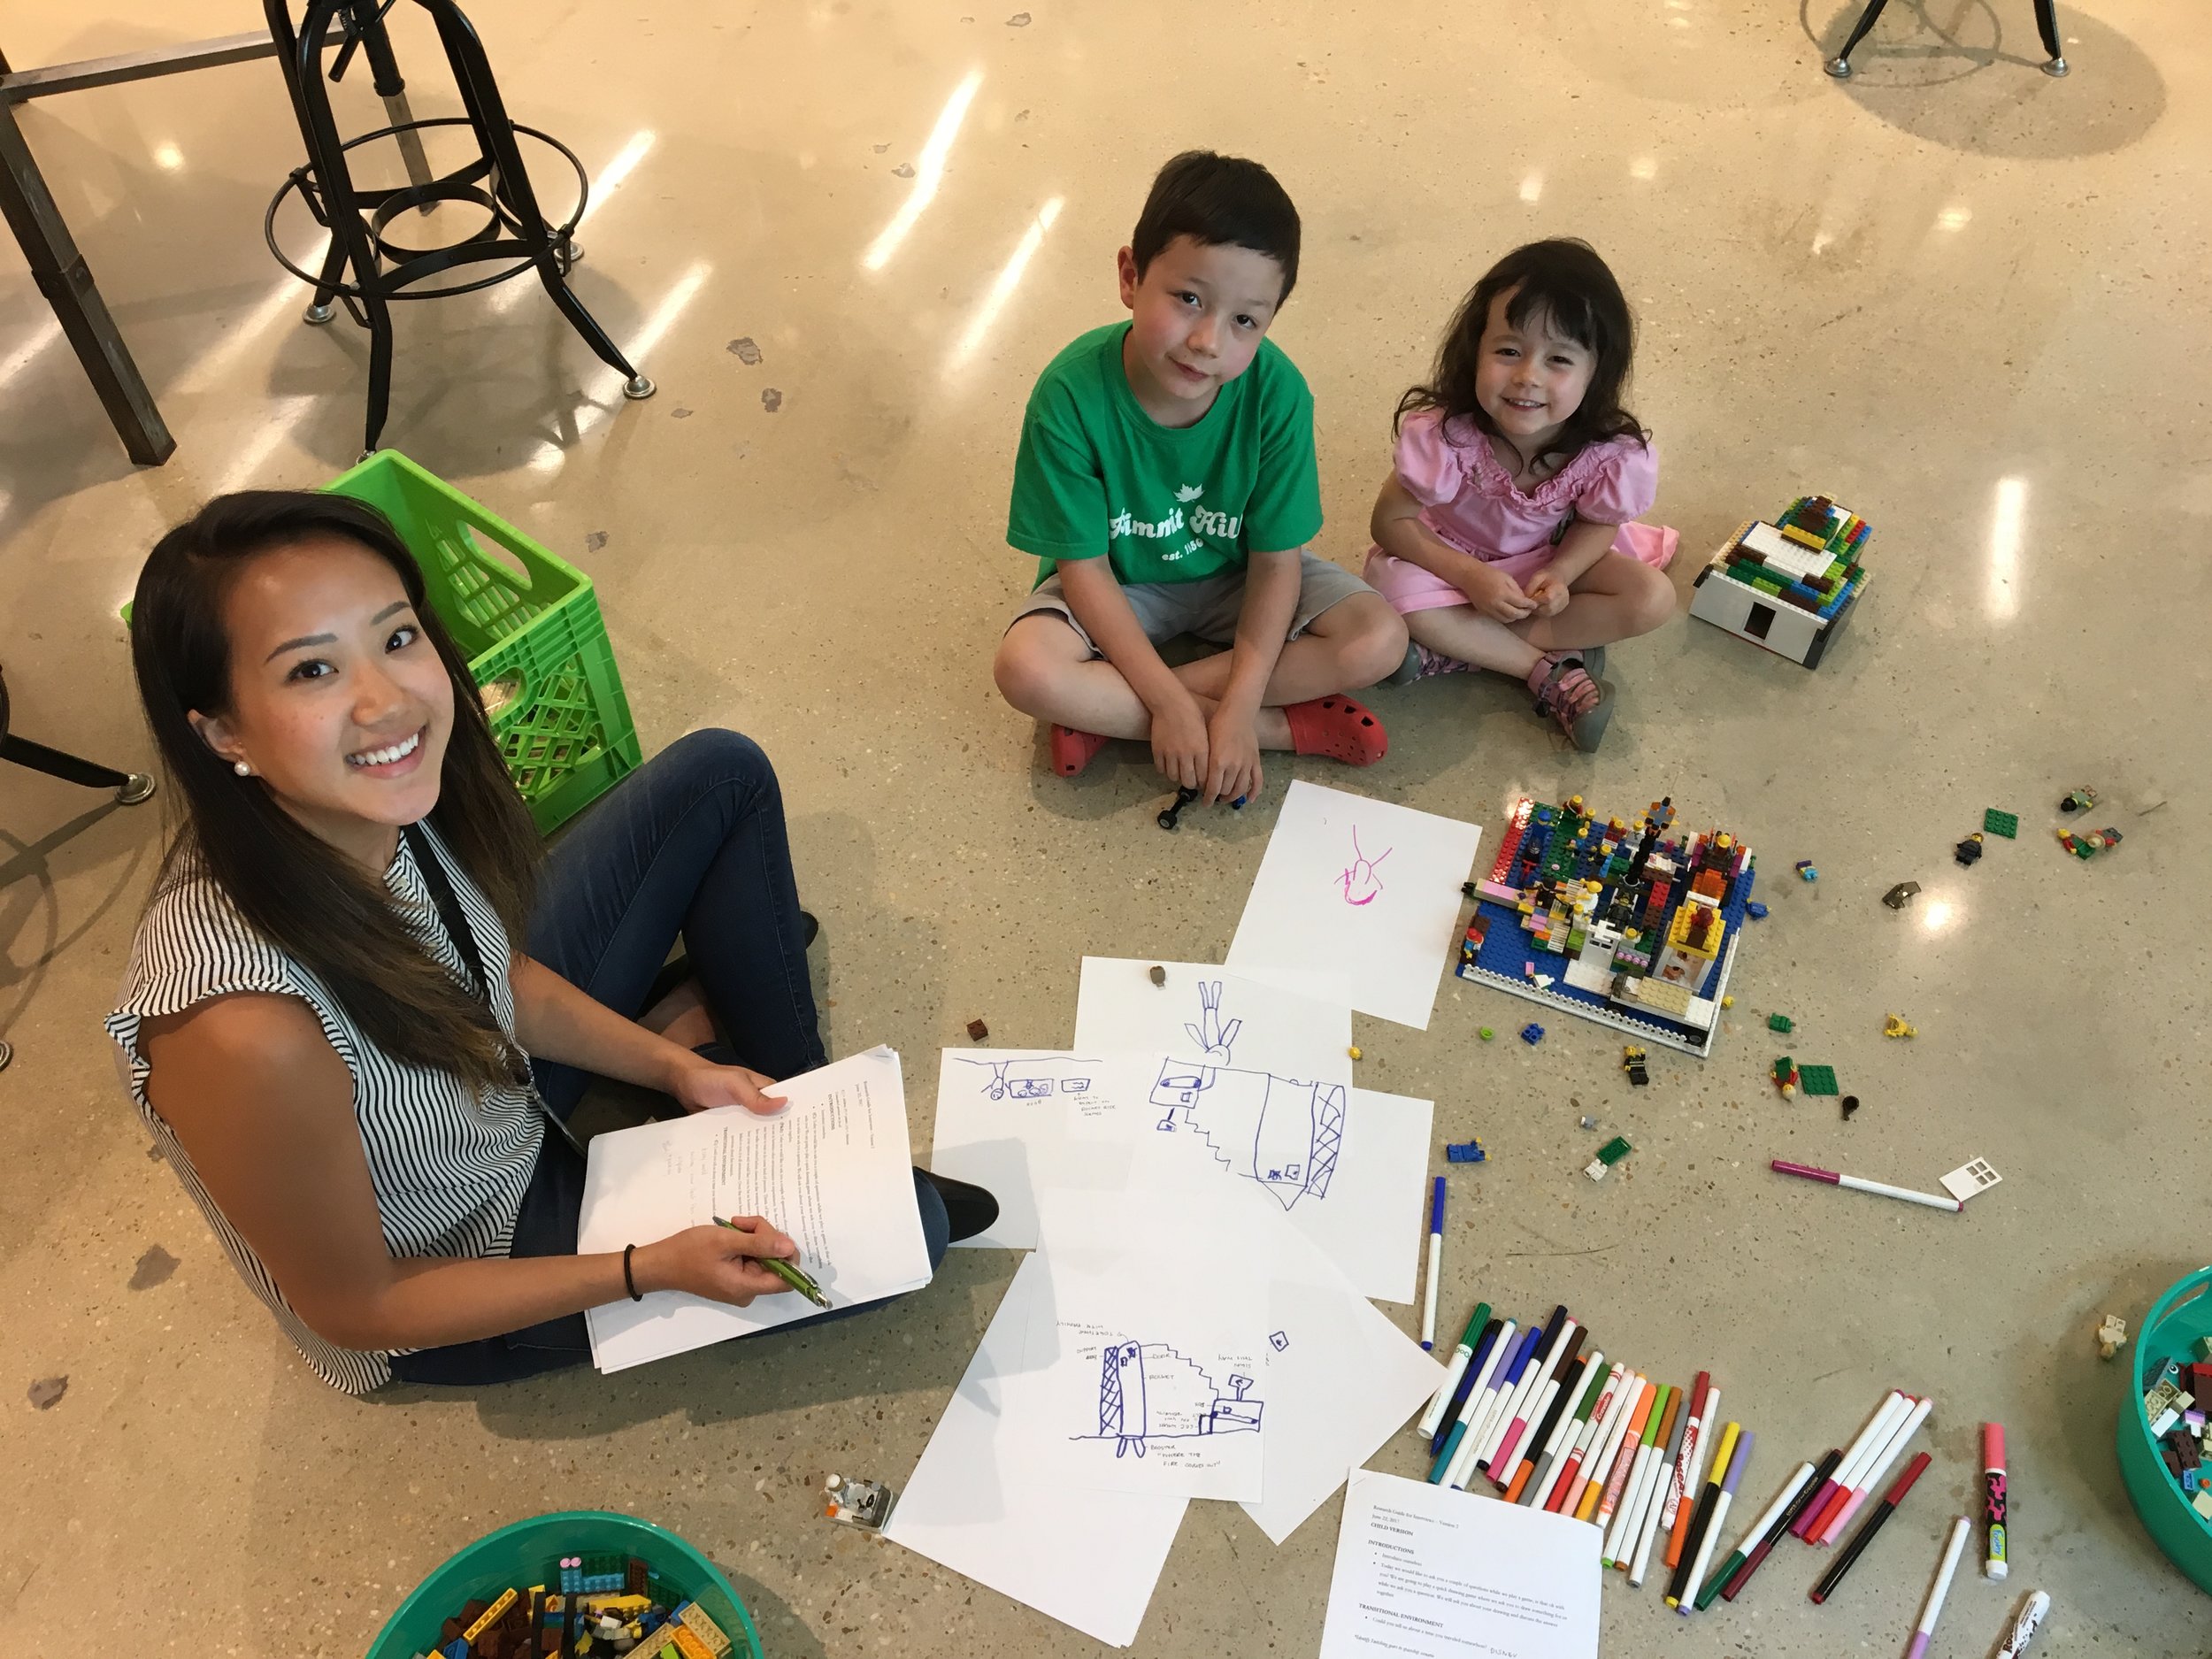
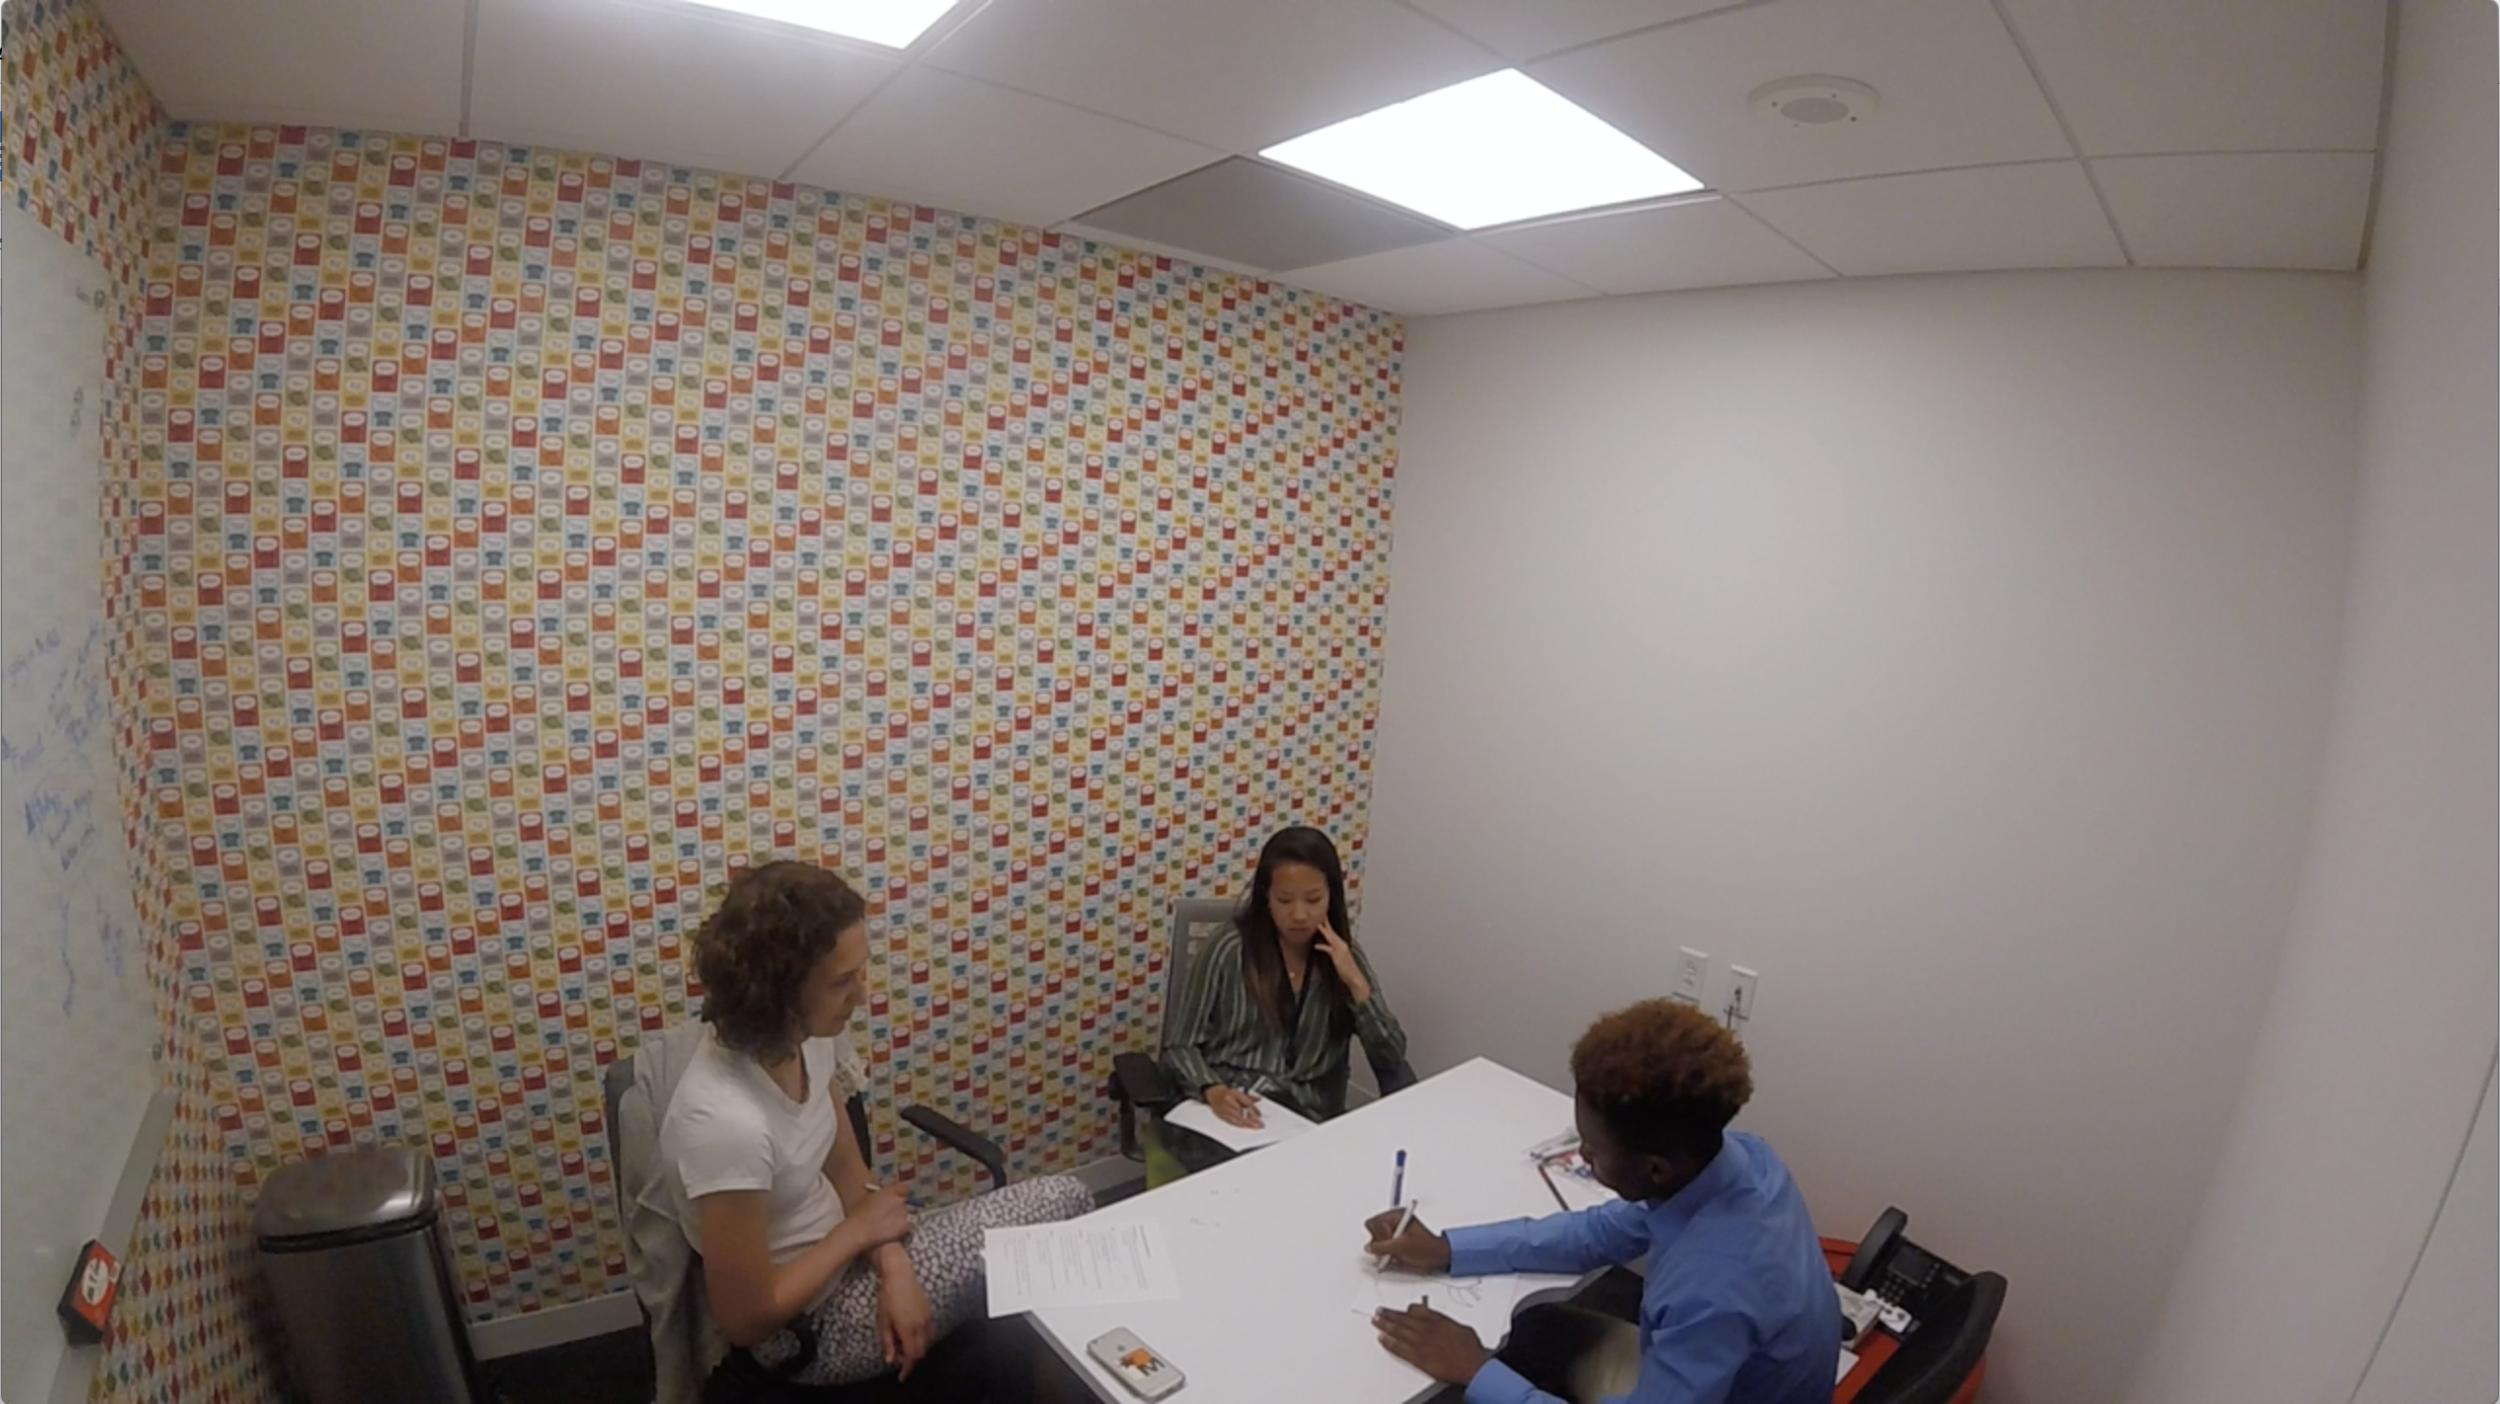
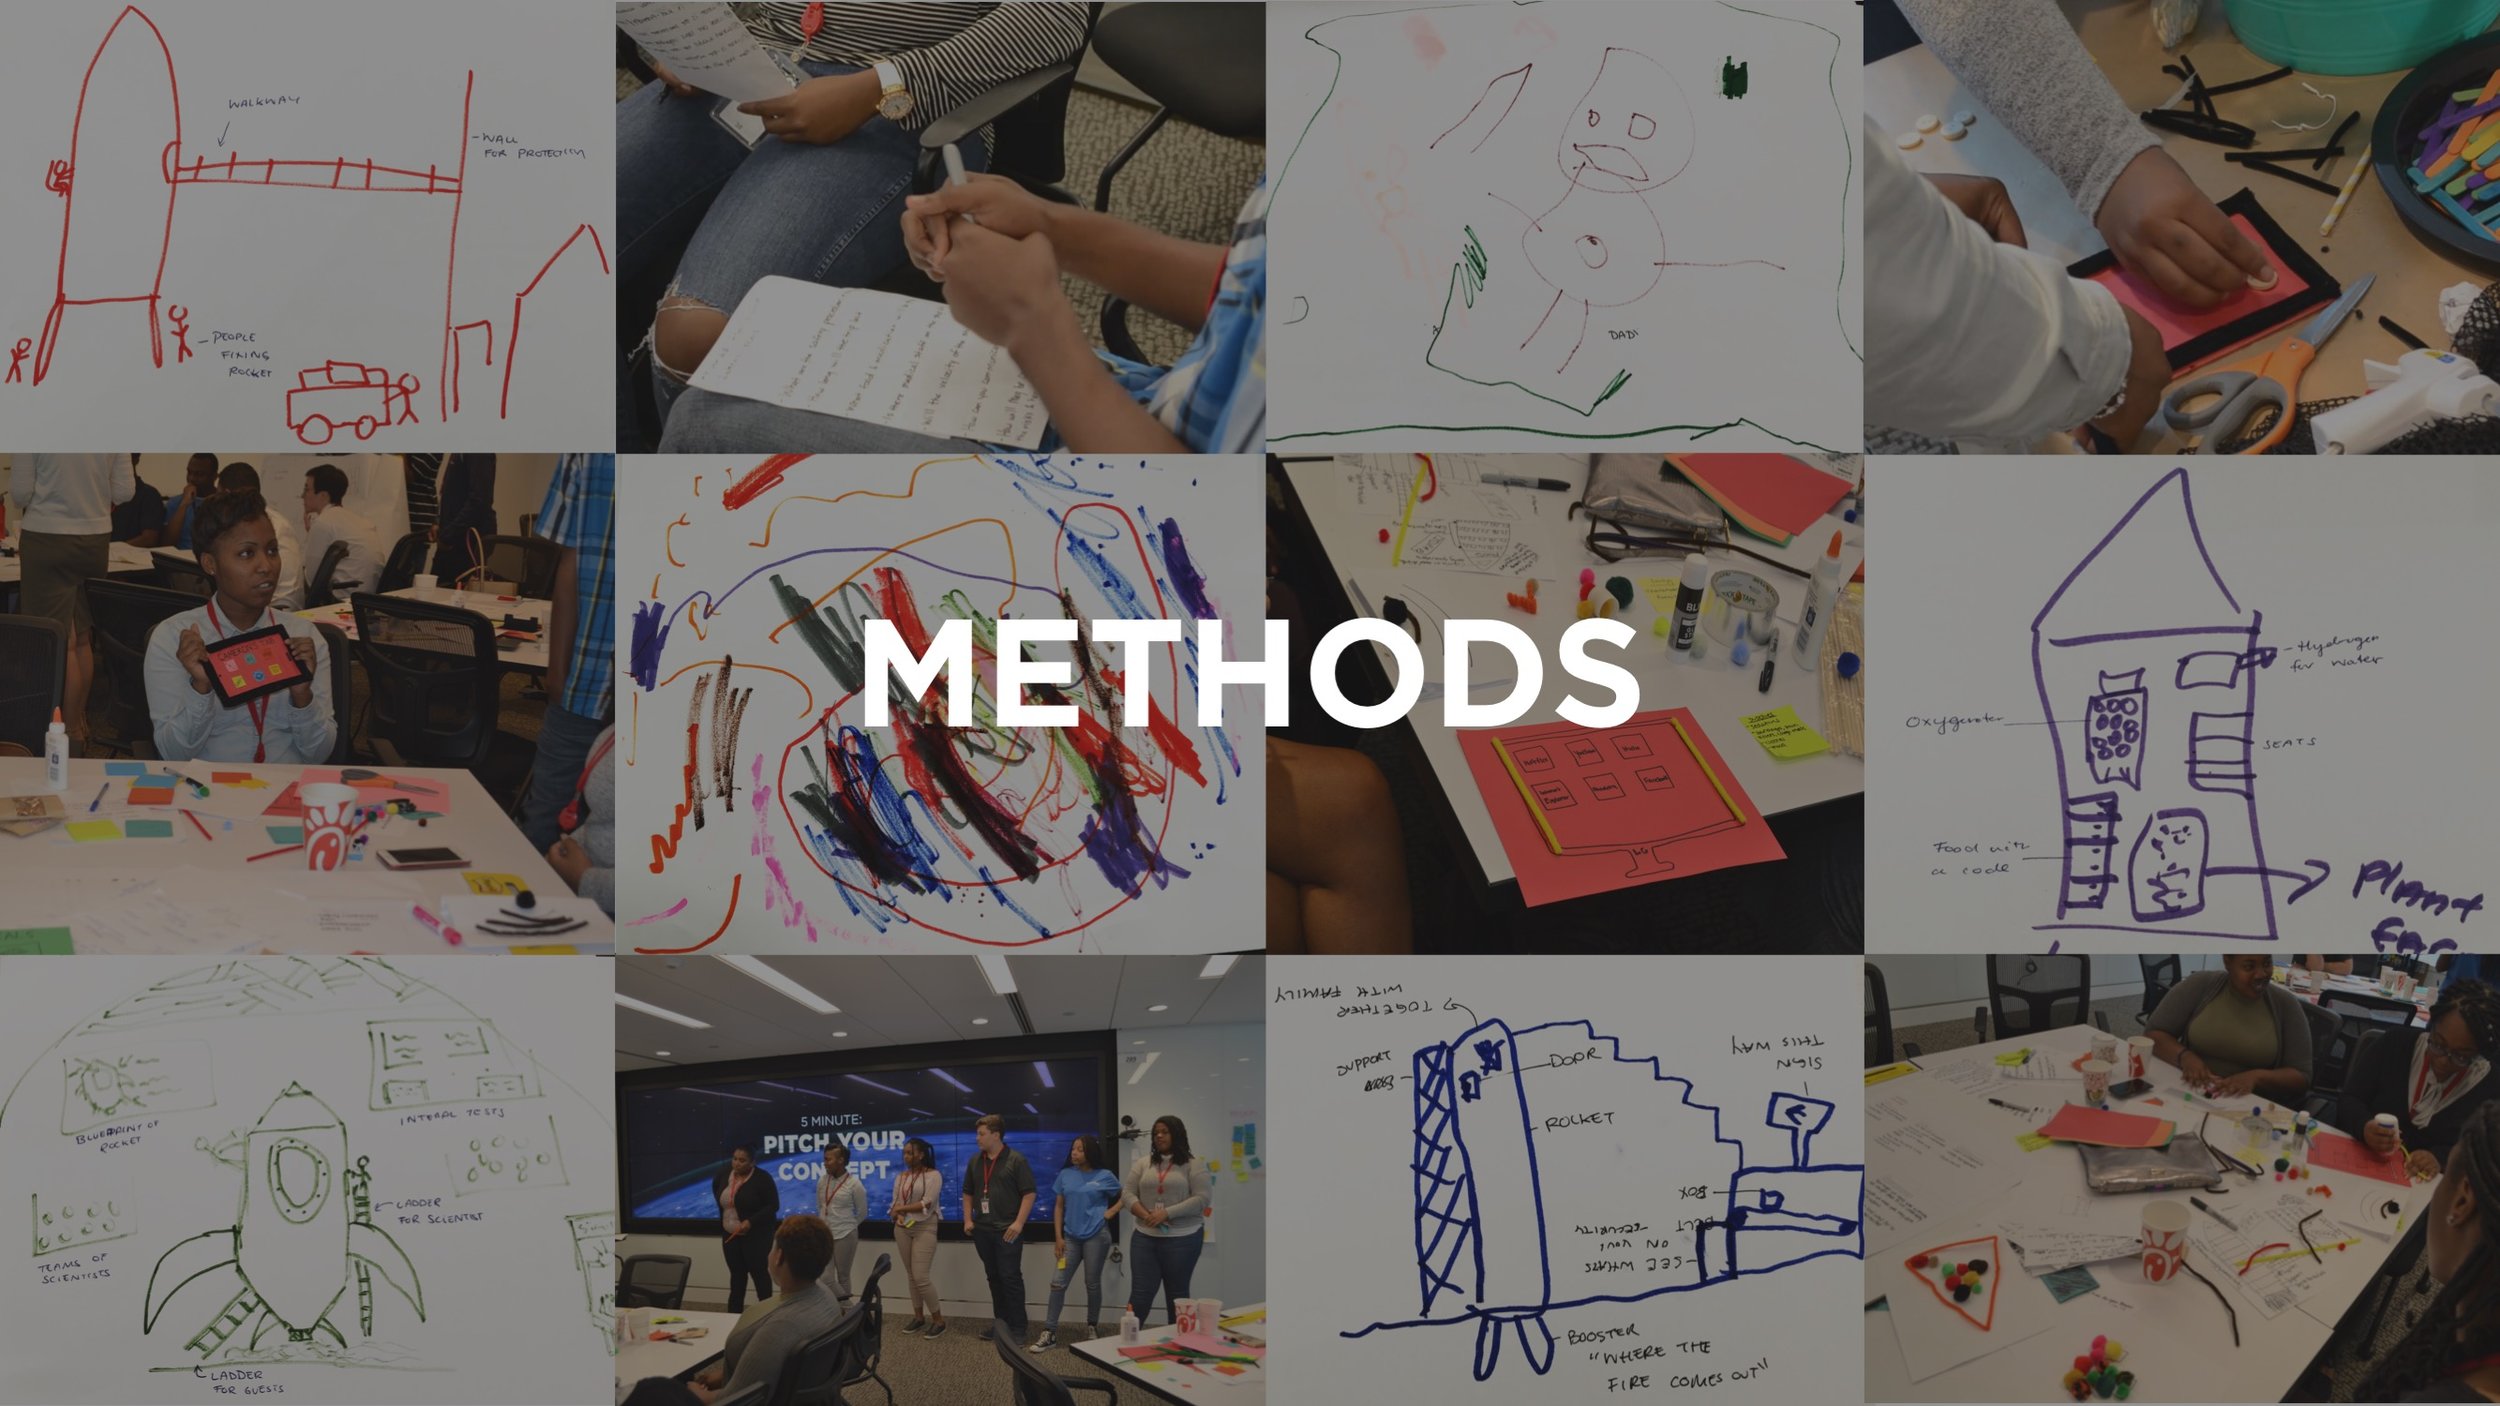
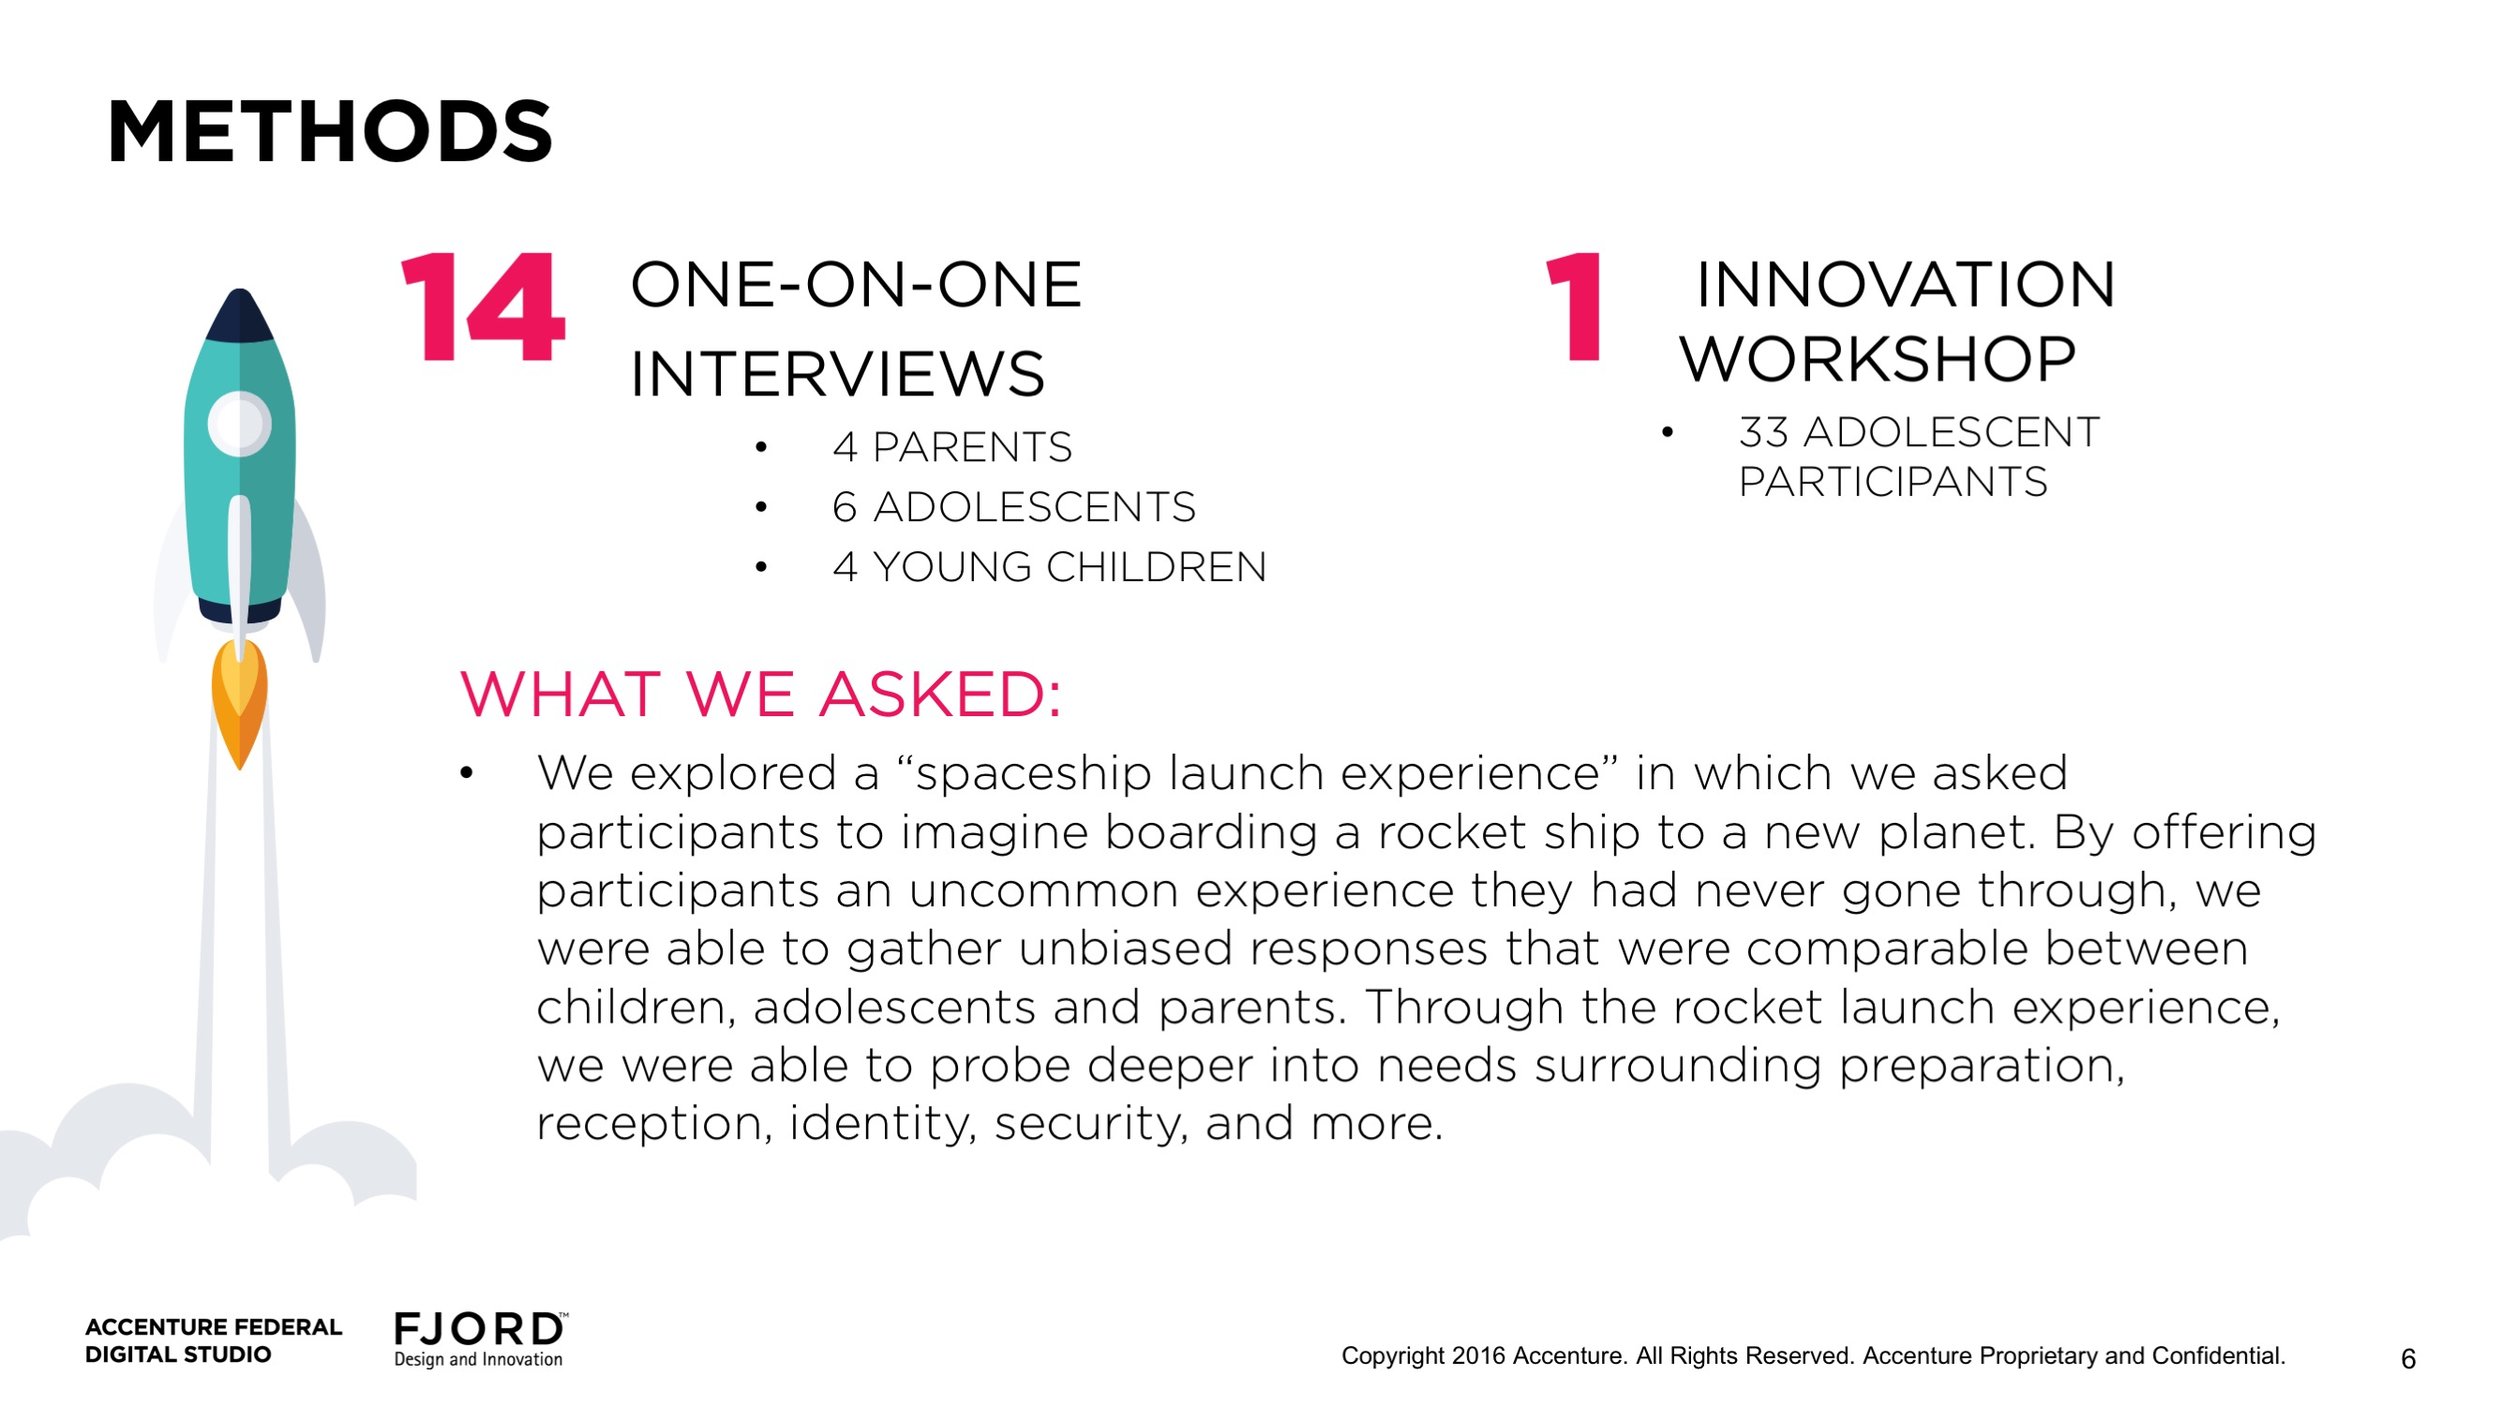
This project required that we interview an age range of children. We spoke to children from age 2 to 17 and, because of the broad spectrum of cognitive development, we created a variety of interview structures. For younger children we created collaborative “play” sessions where the children would play and converse with the researcher. Older children were interviewed more directly, although they were also asked to collaborate with the research on creative questions such as “(1) Could you draw what you think you will see when you walk into the rocket launch zone? (2) If you need help, what should be there to help?” Parent interviews were in a casual/ conversational manner both in homes or at the studio.

Our interviews took on the narrative of a family preparing to go on a space voyage in a rocket ship to make the metaphysical nature of what we were researching understandable. We asked children and adults how they might prepare themselves and their families for such a voyage; how they might approach emerging technology; and how they might want their identity to be captured and stored in this new transitional environment.

Discovery Workshop with Young Adults:

After the interviews we had the opportunity to conduct a workshop with a group of young adults interested in learning about design. I constructed a workshop agenda in which I asked the young adults to be researchers and designers with our team for a day, and to explore the issues surrounding transitional environments. The group was broken up into 6 teams and asked to complete a series of design thinking, prototyping, presenting and reflection exercises. Ultimately, the teams created a final design and pitched the work to the entire group. Our internal research team was able to gather a plethora of feedback and ideas on what these young adults thought should exist in a transitional environment experience.

Synthesis, Future Concepts and Service Blueprint:

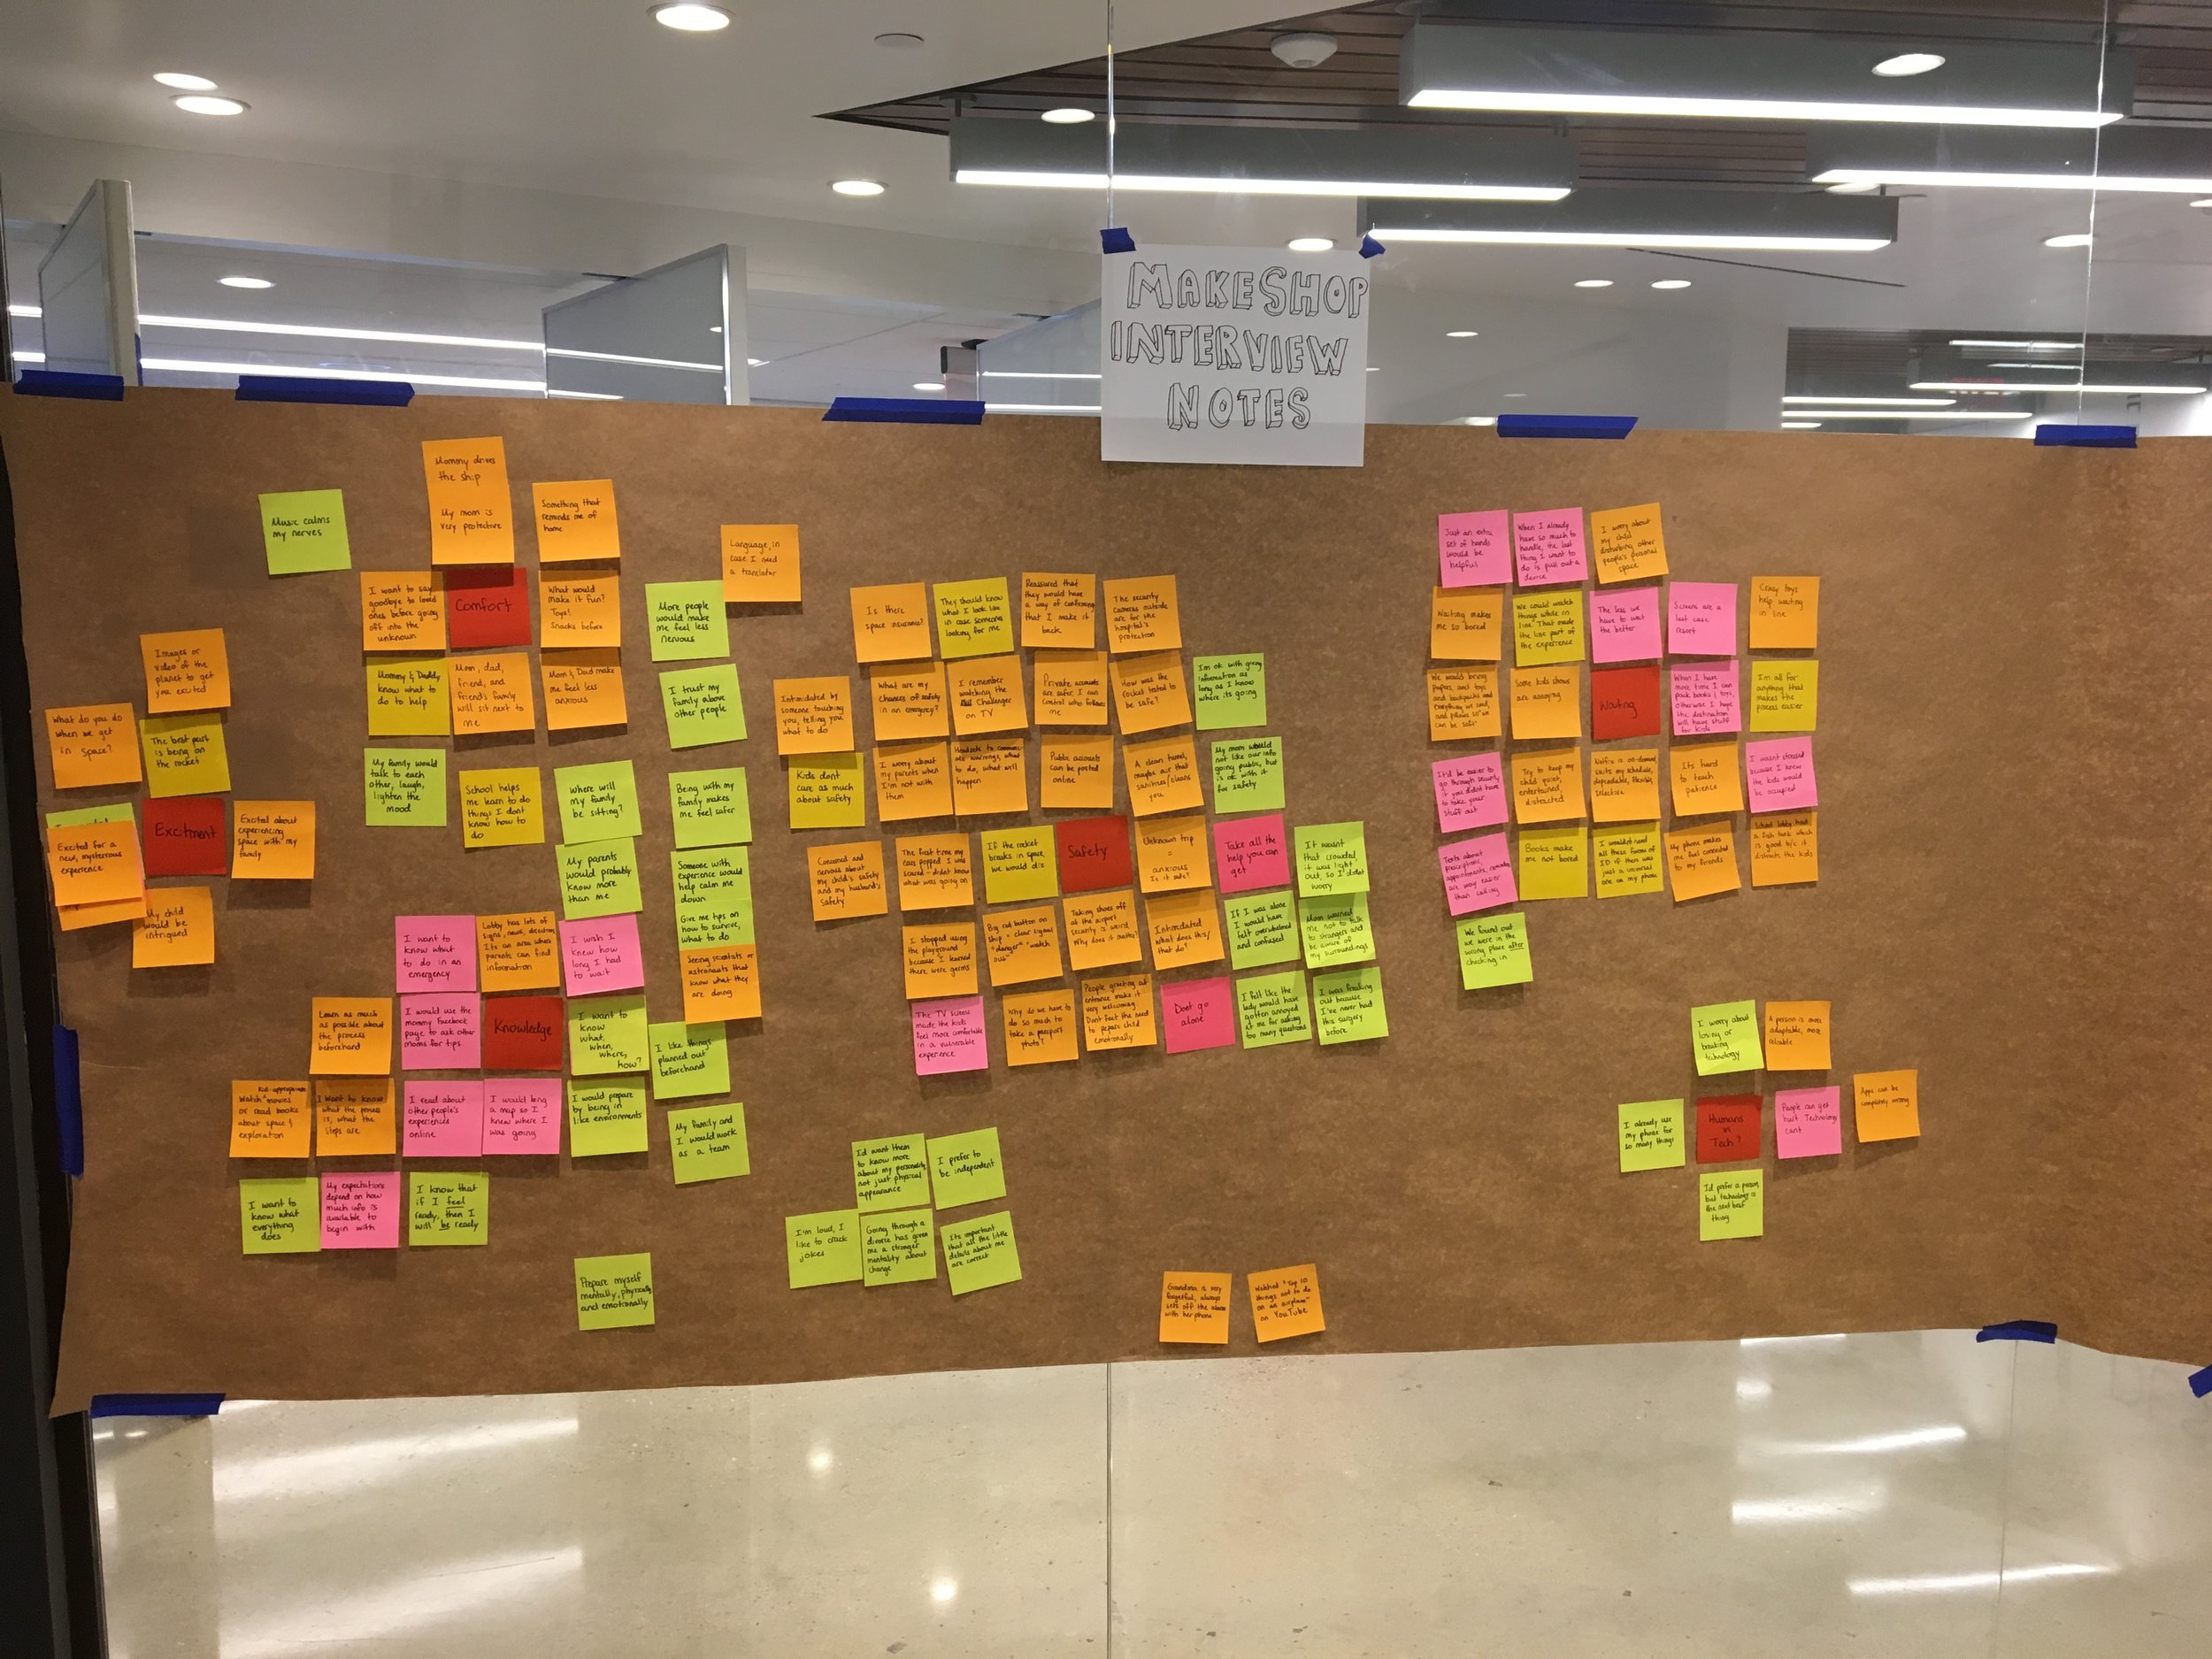
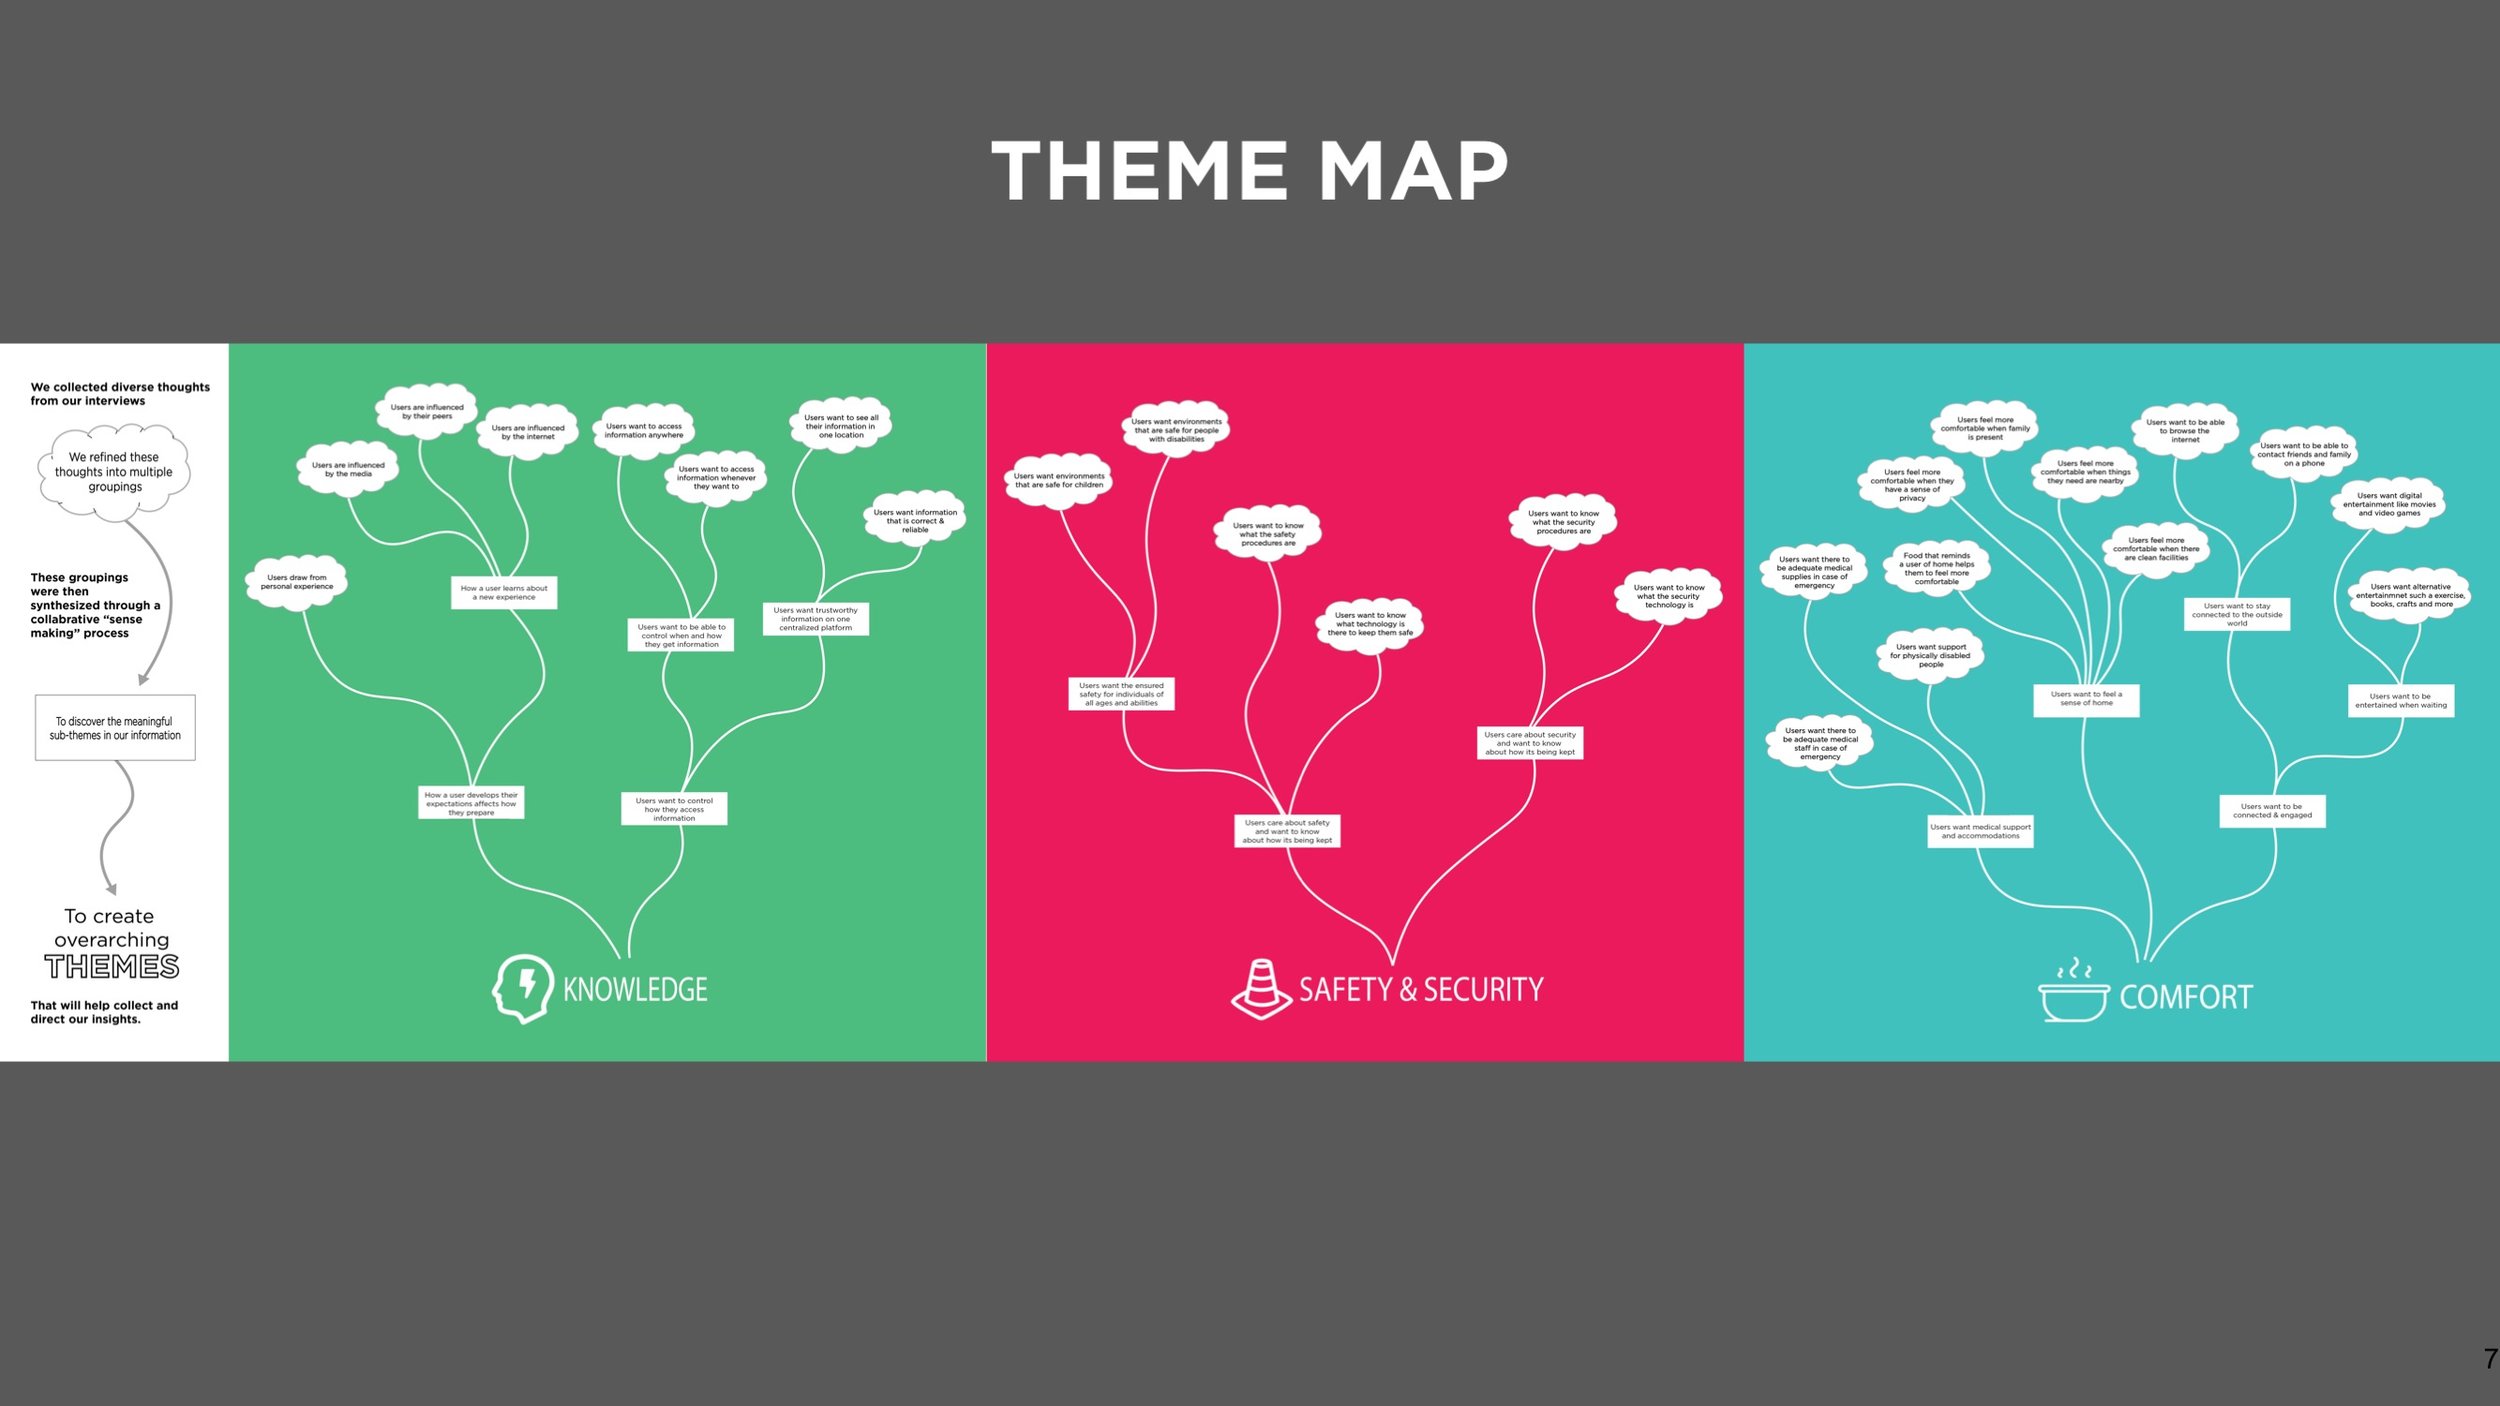
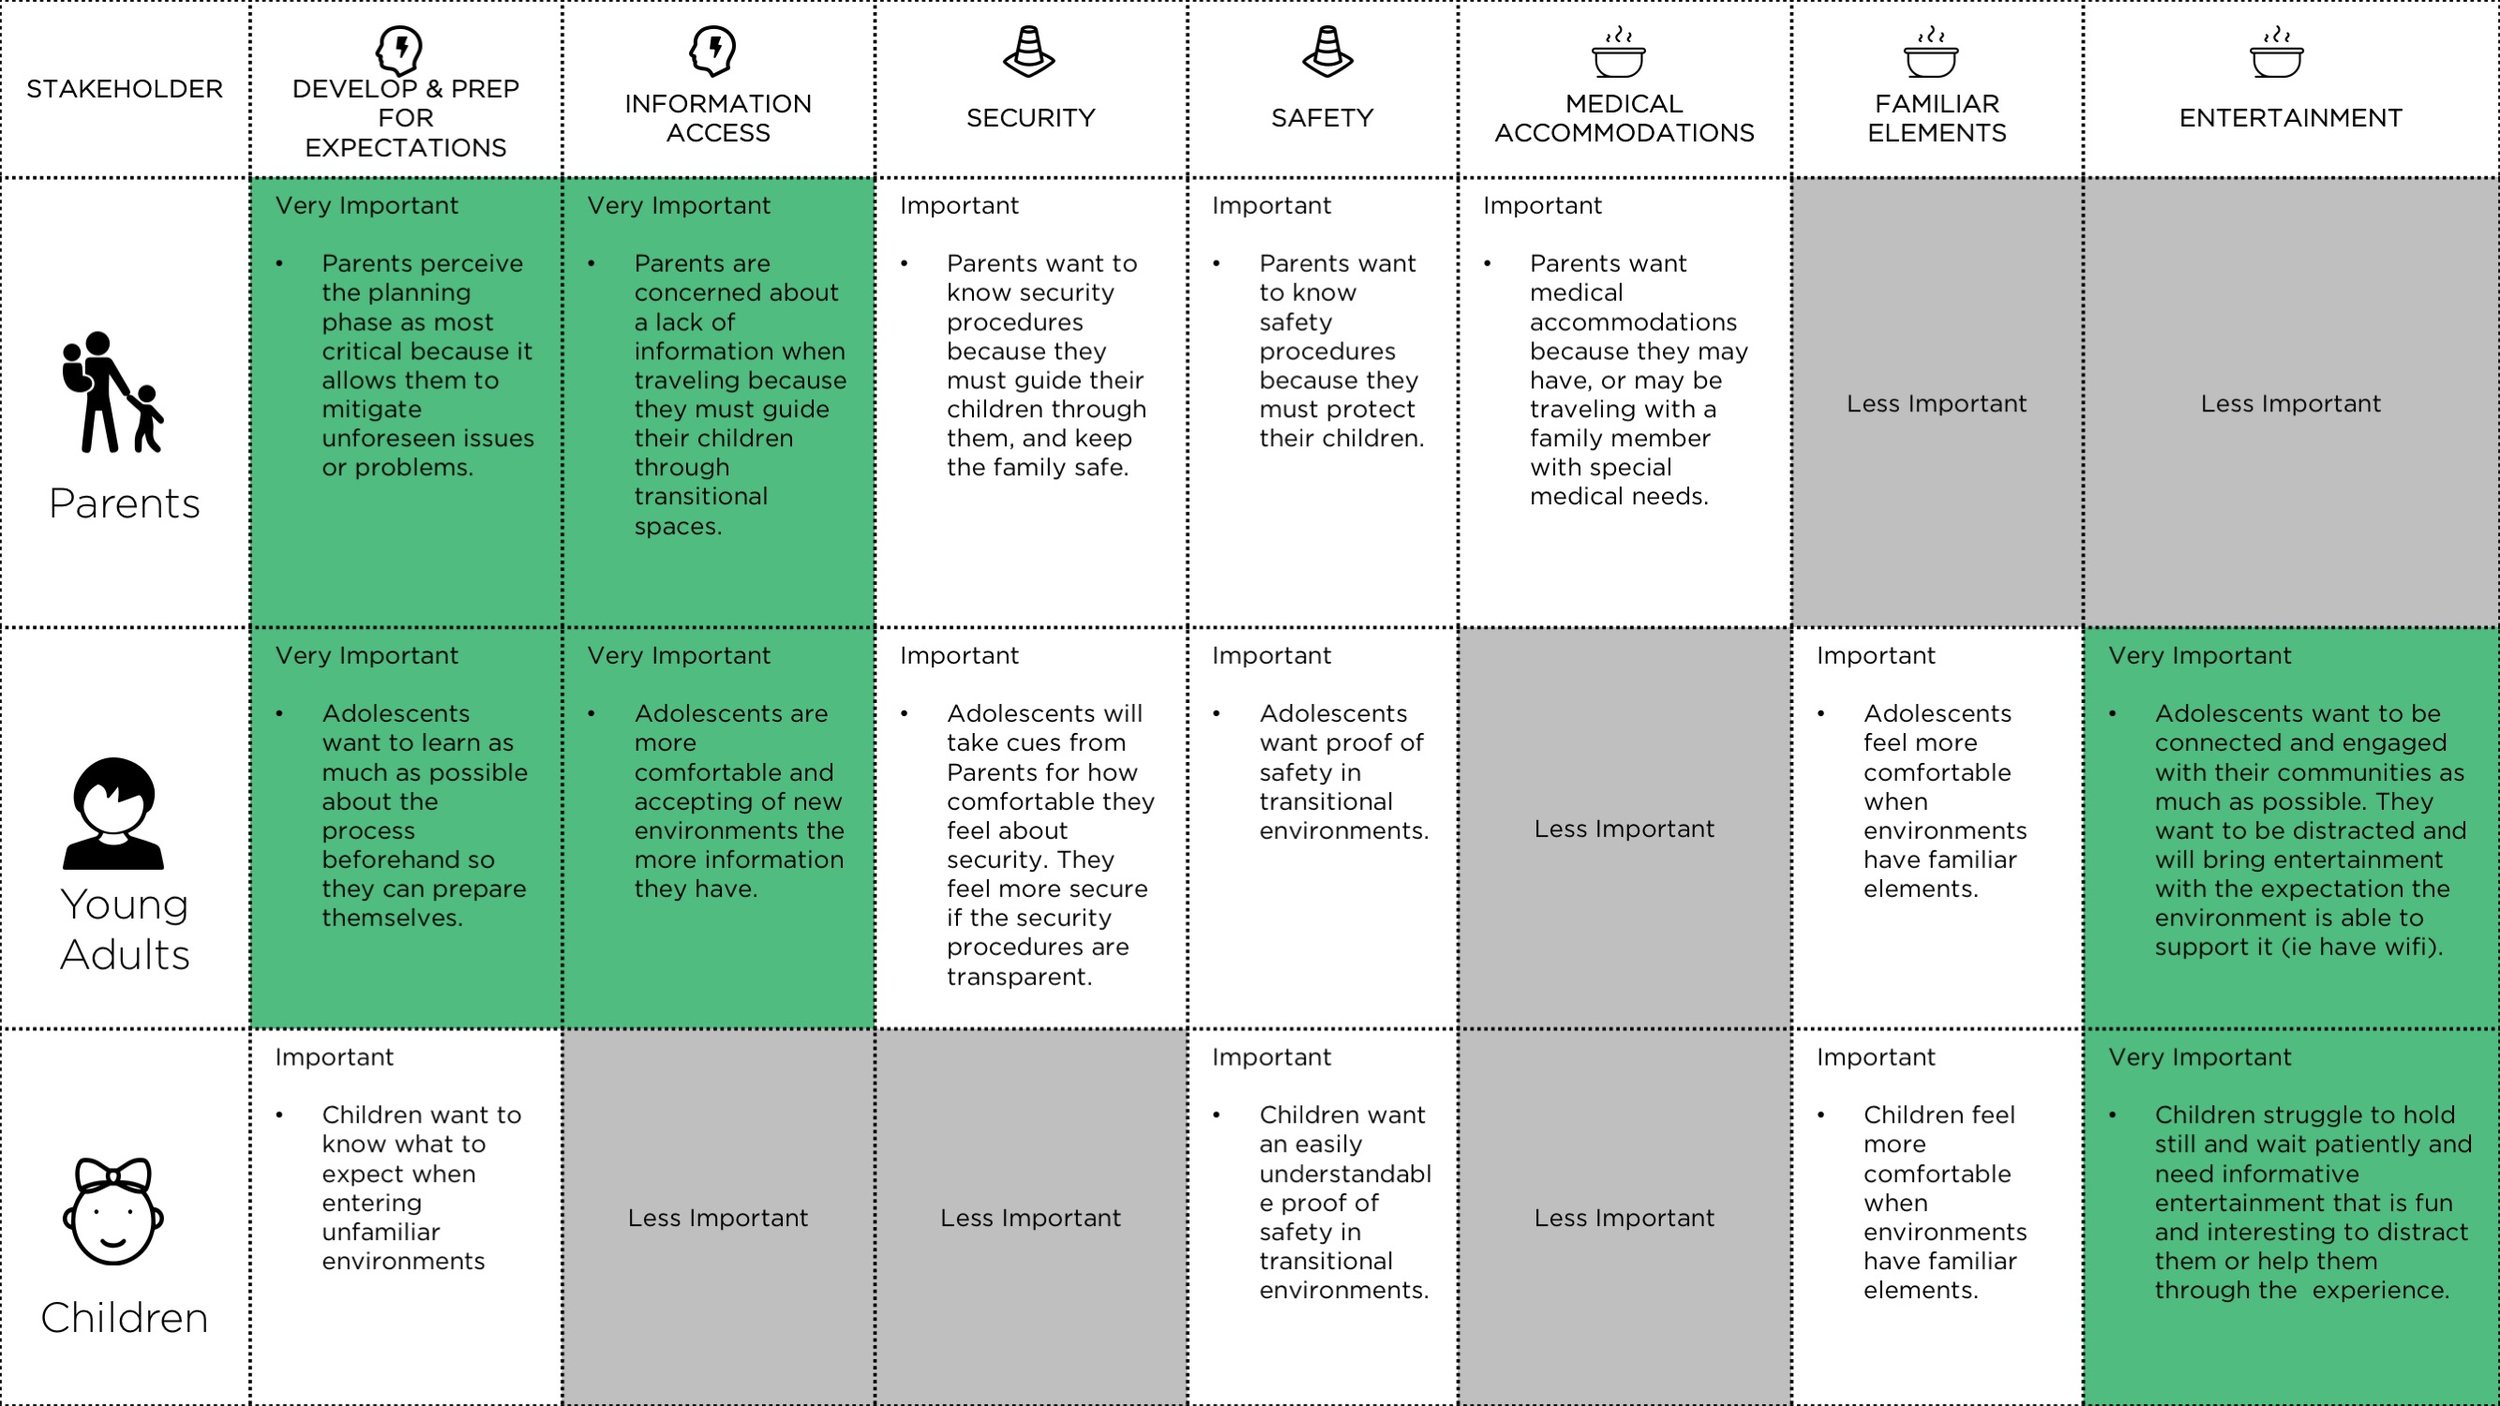
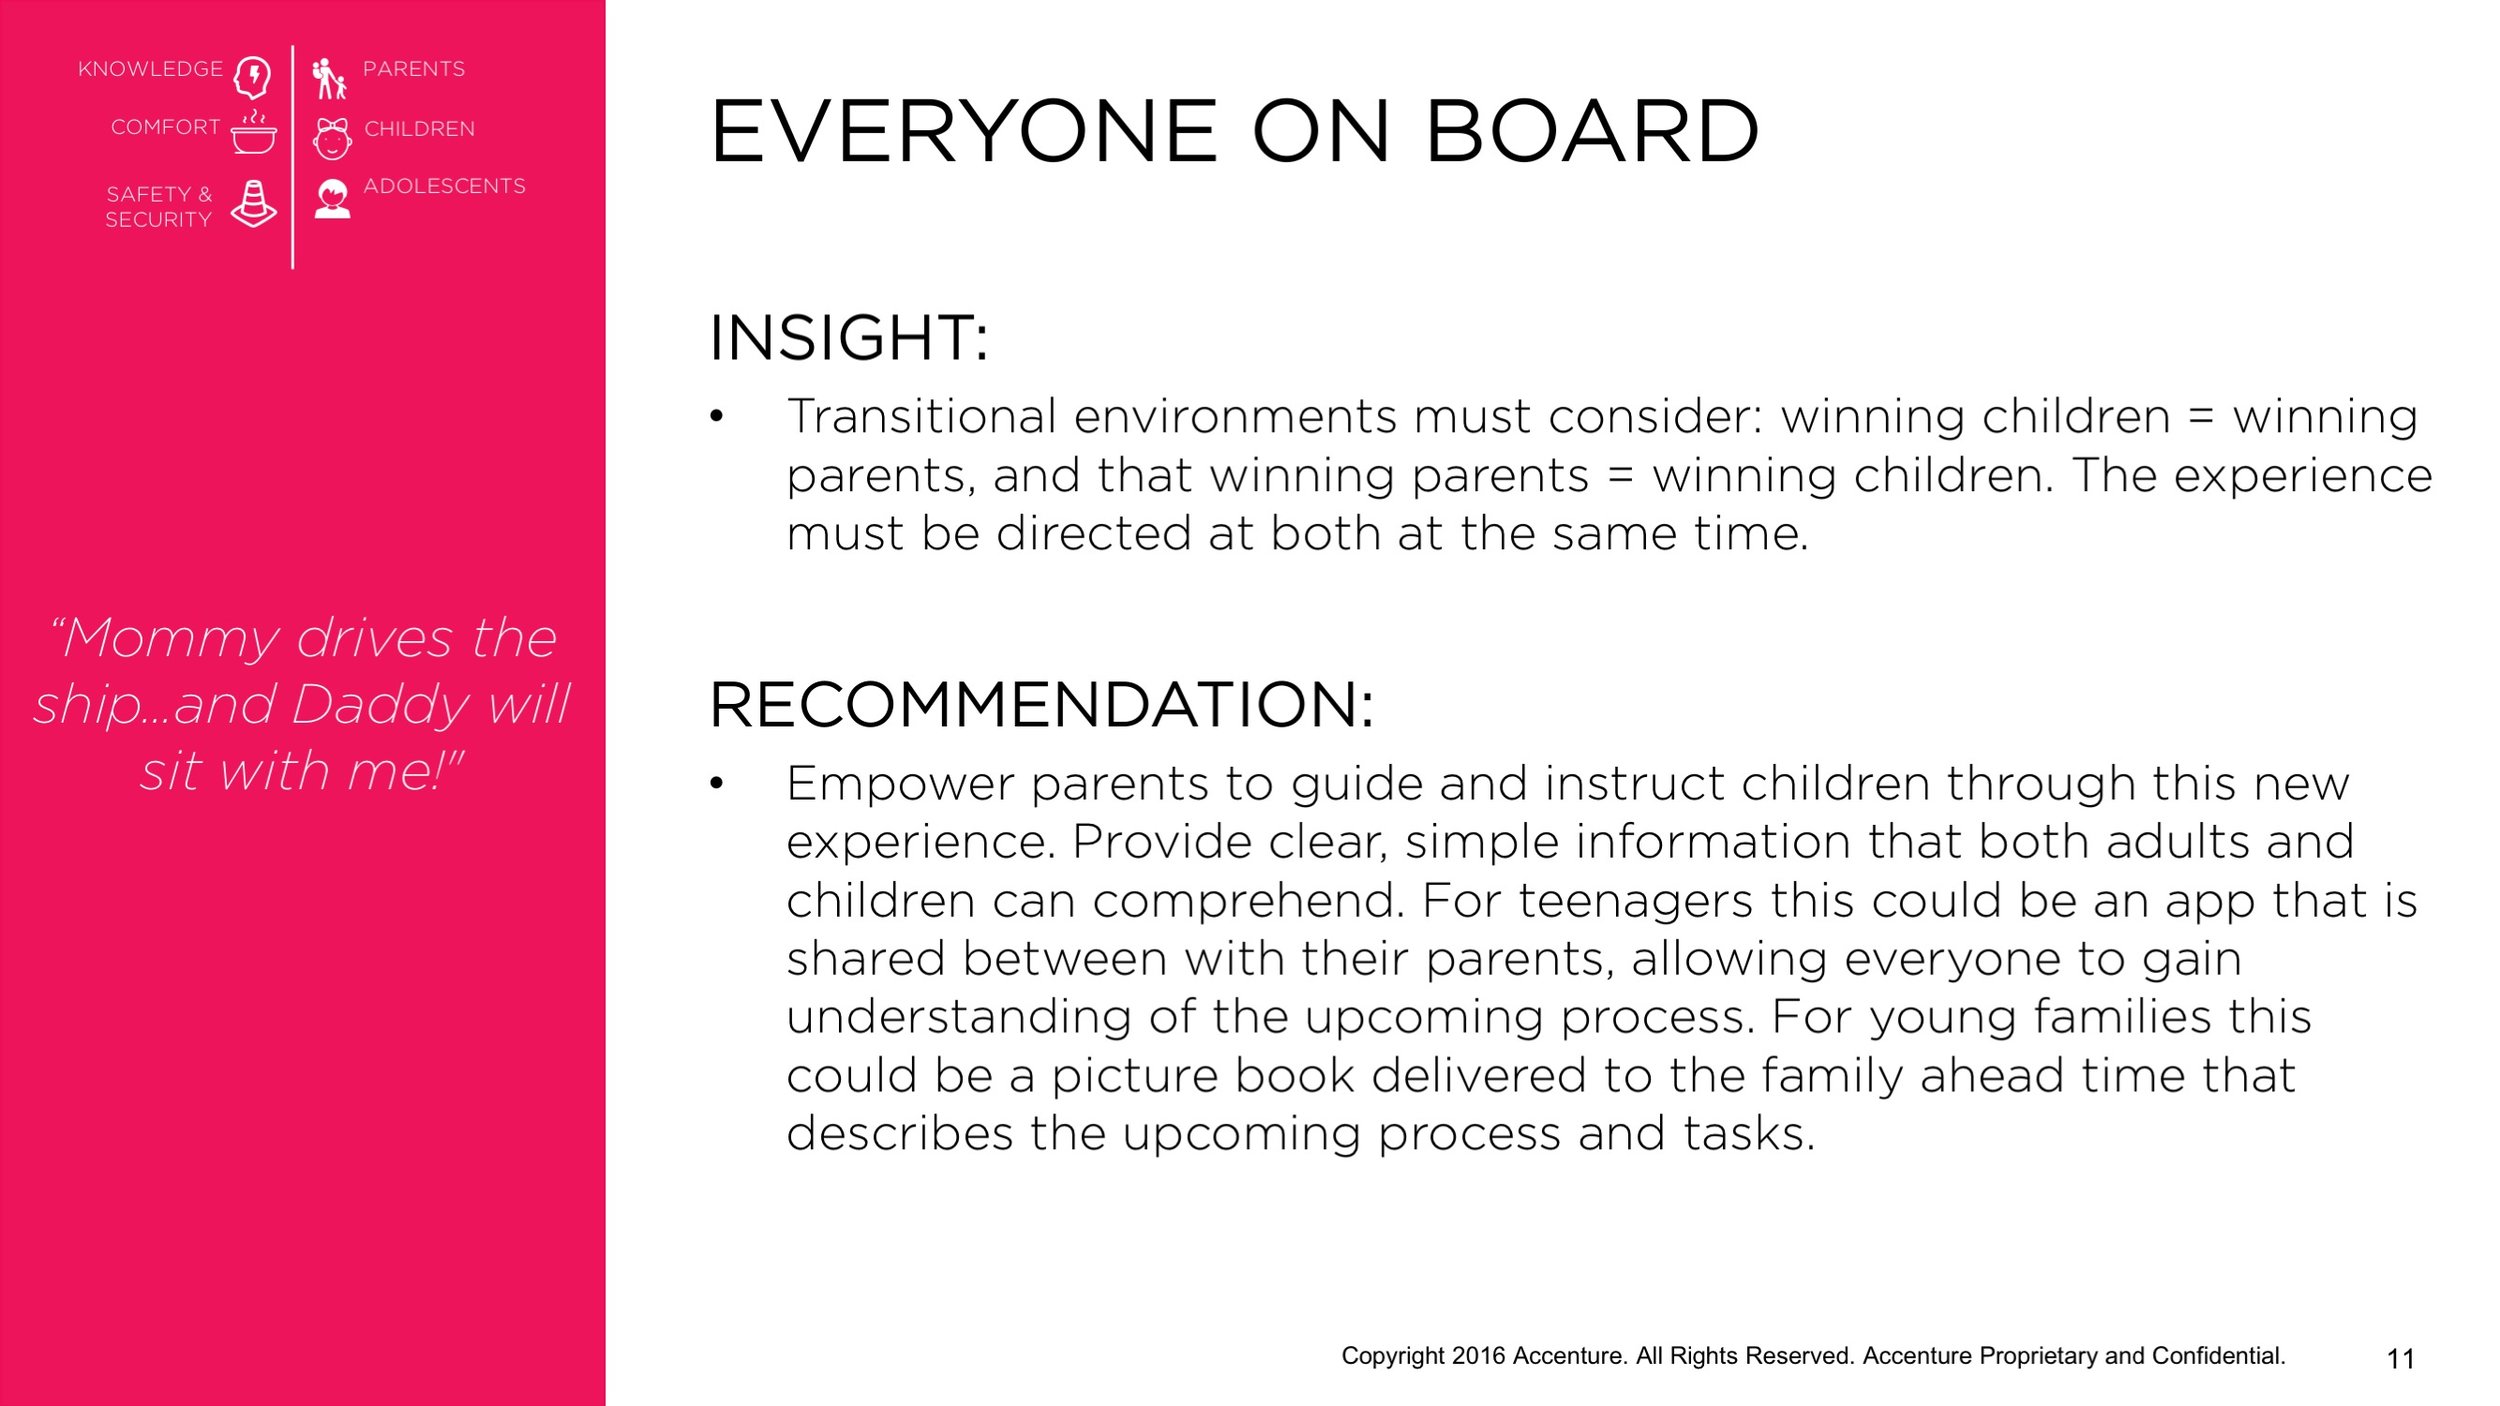
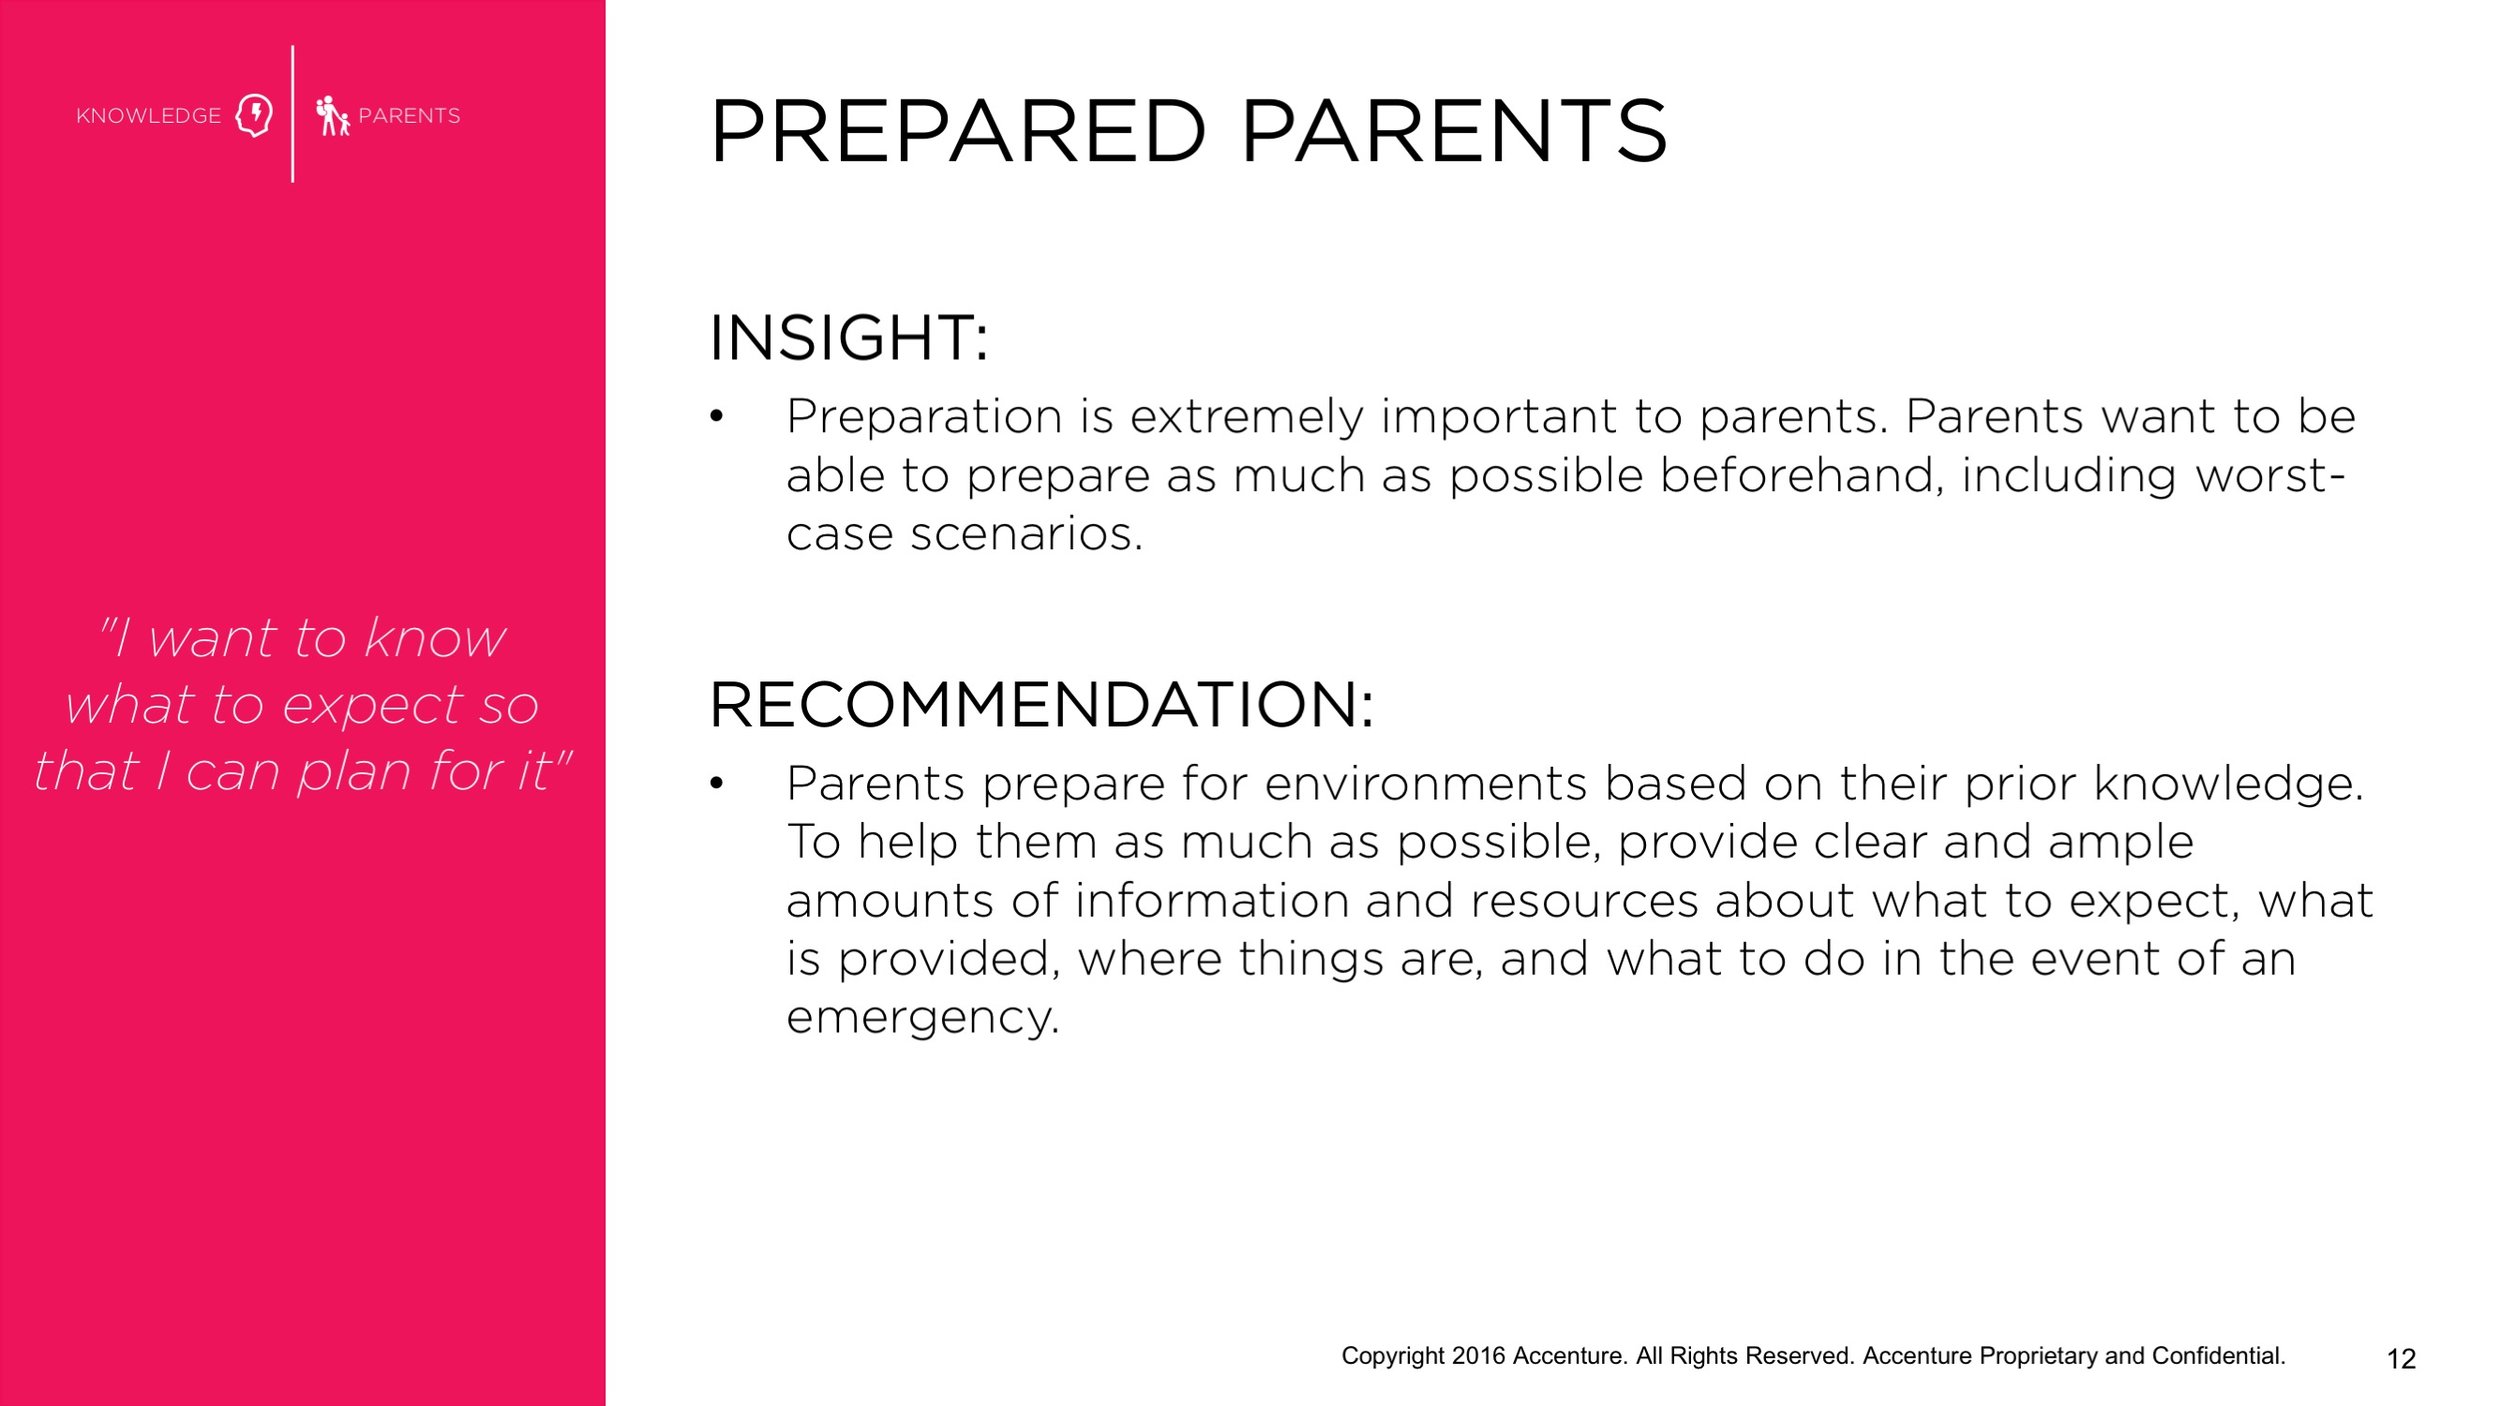
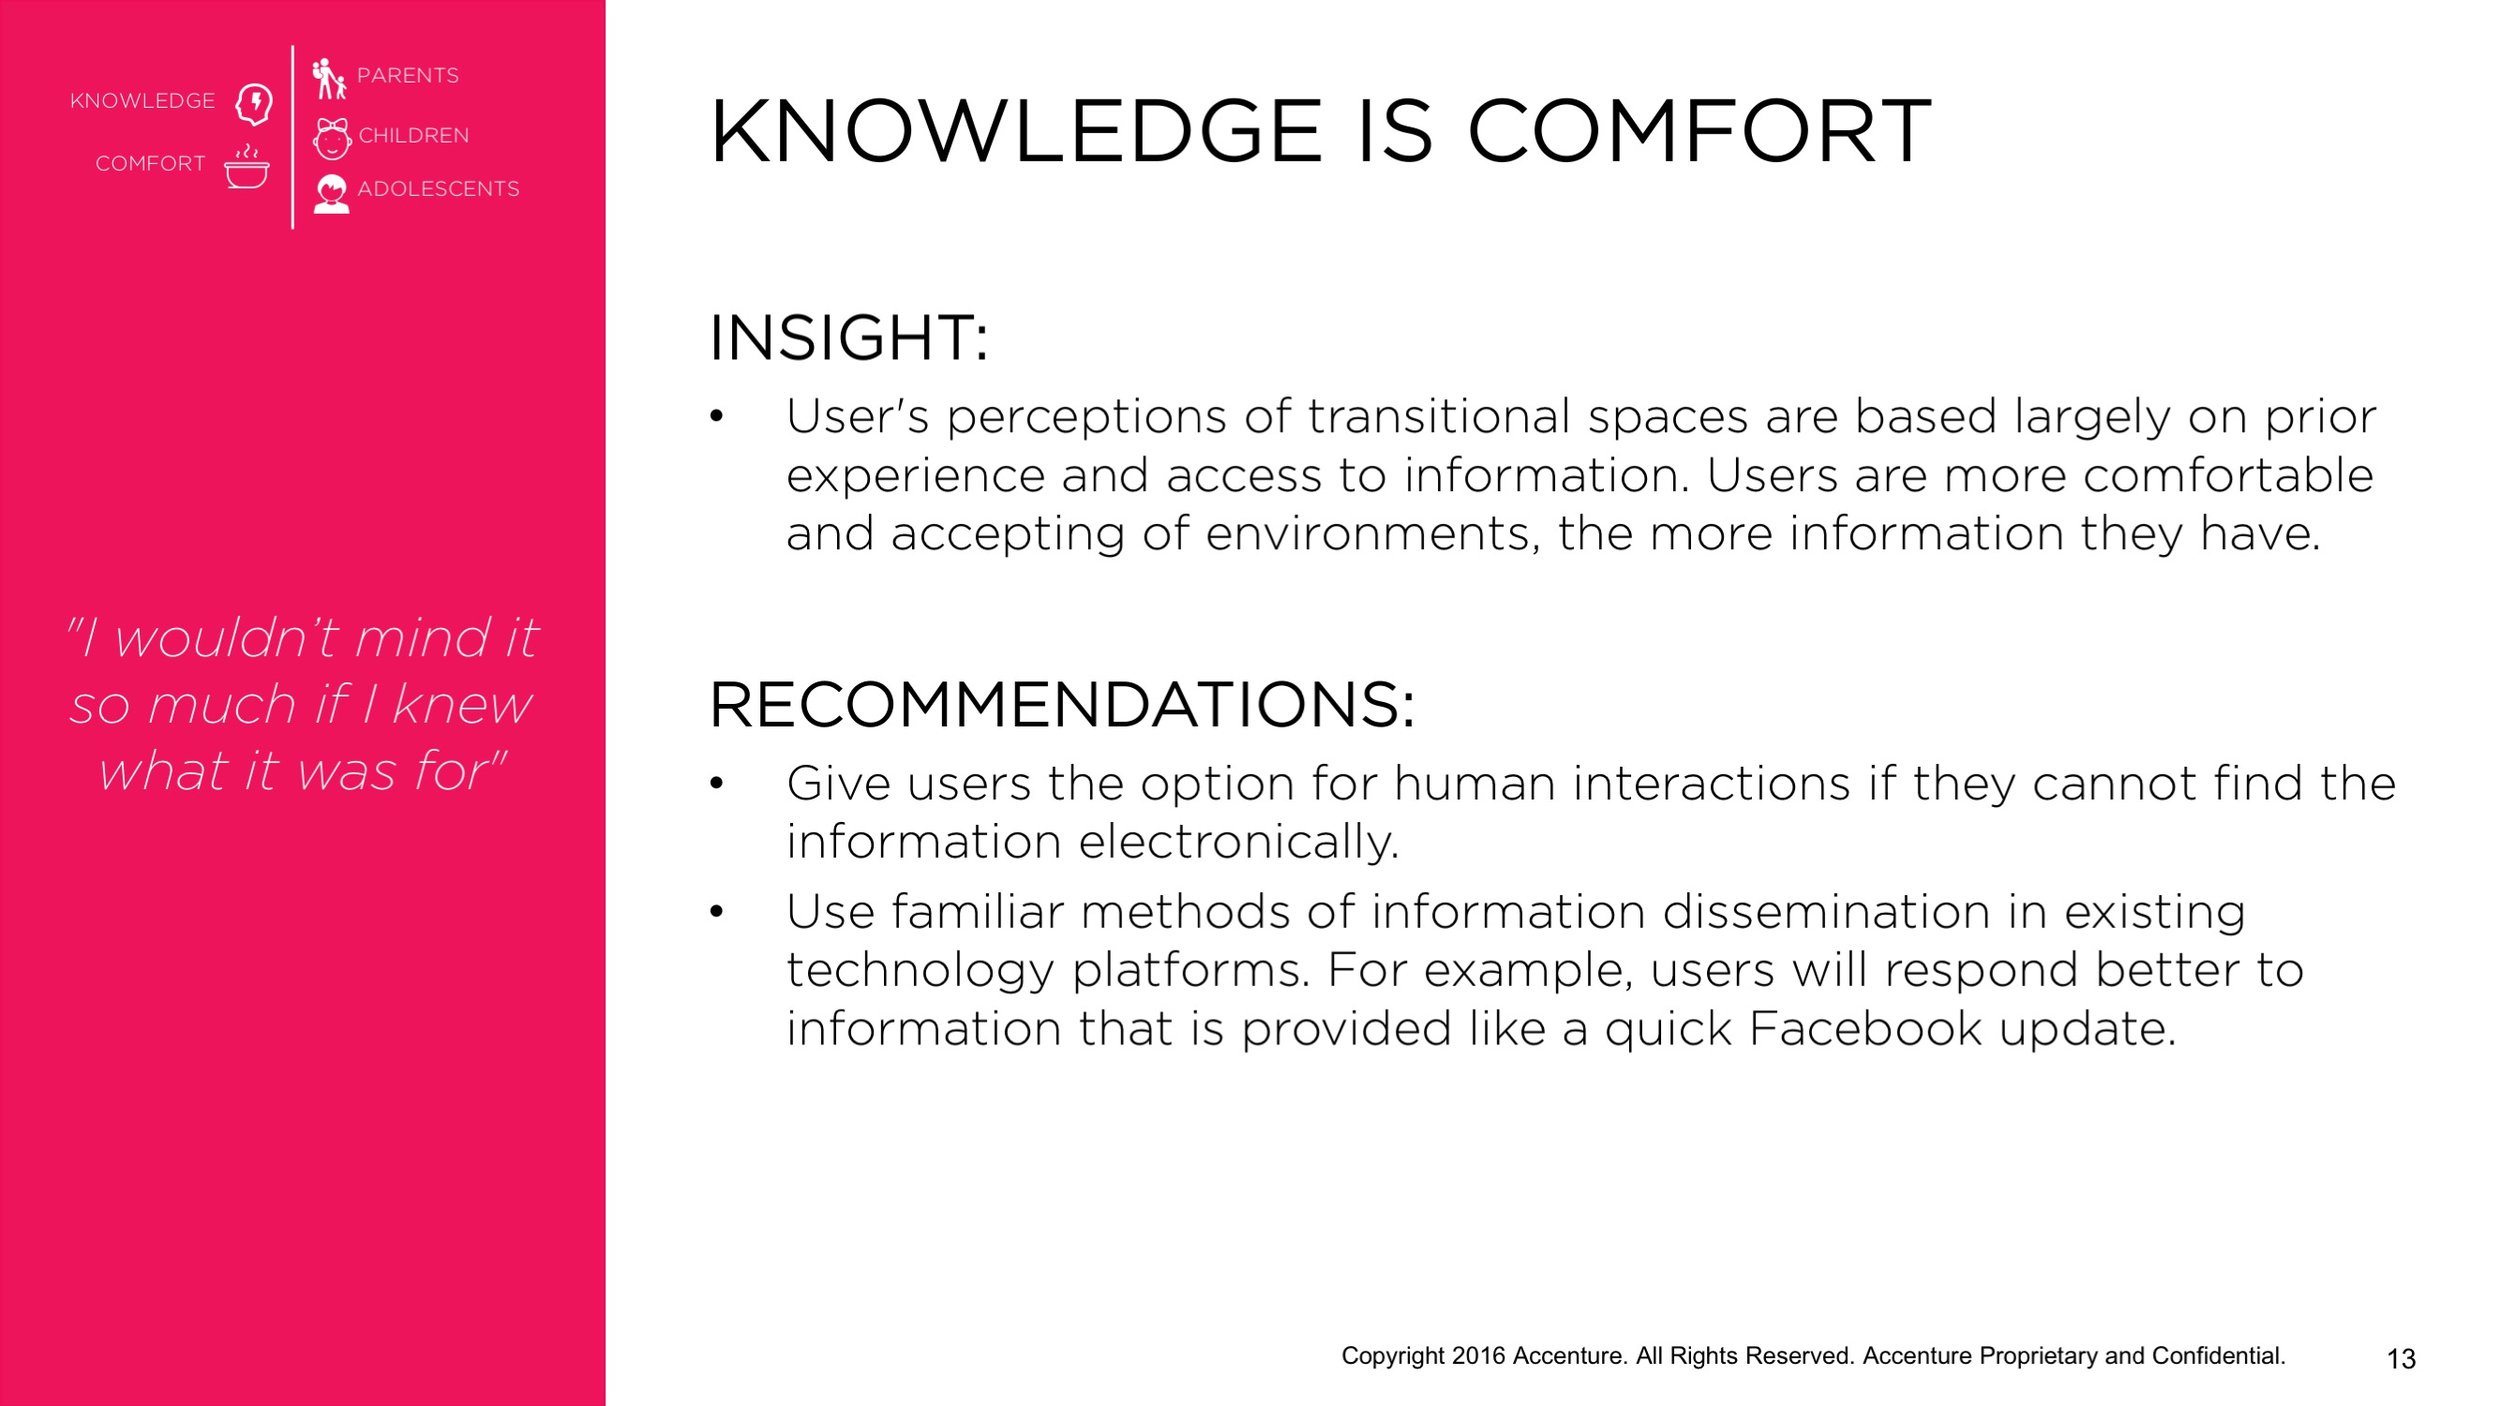
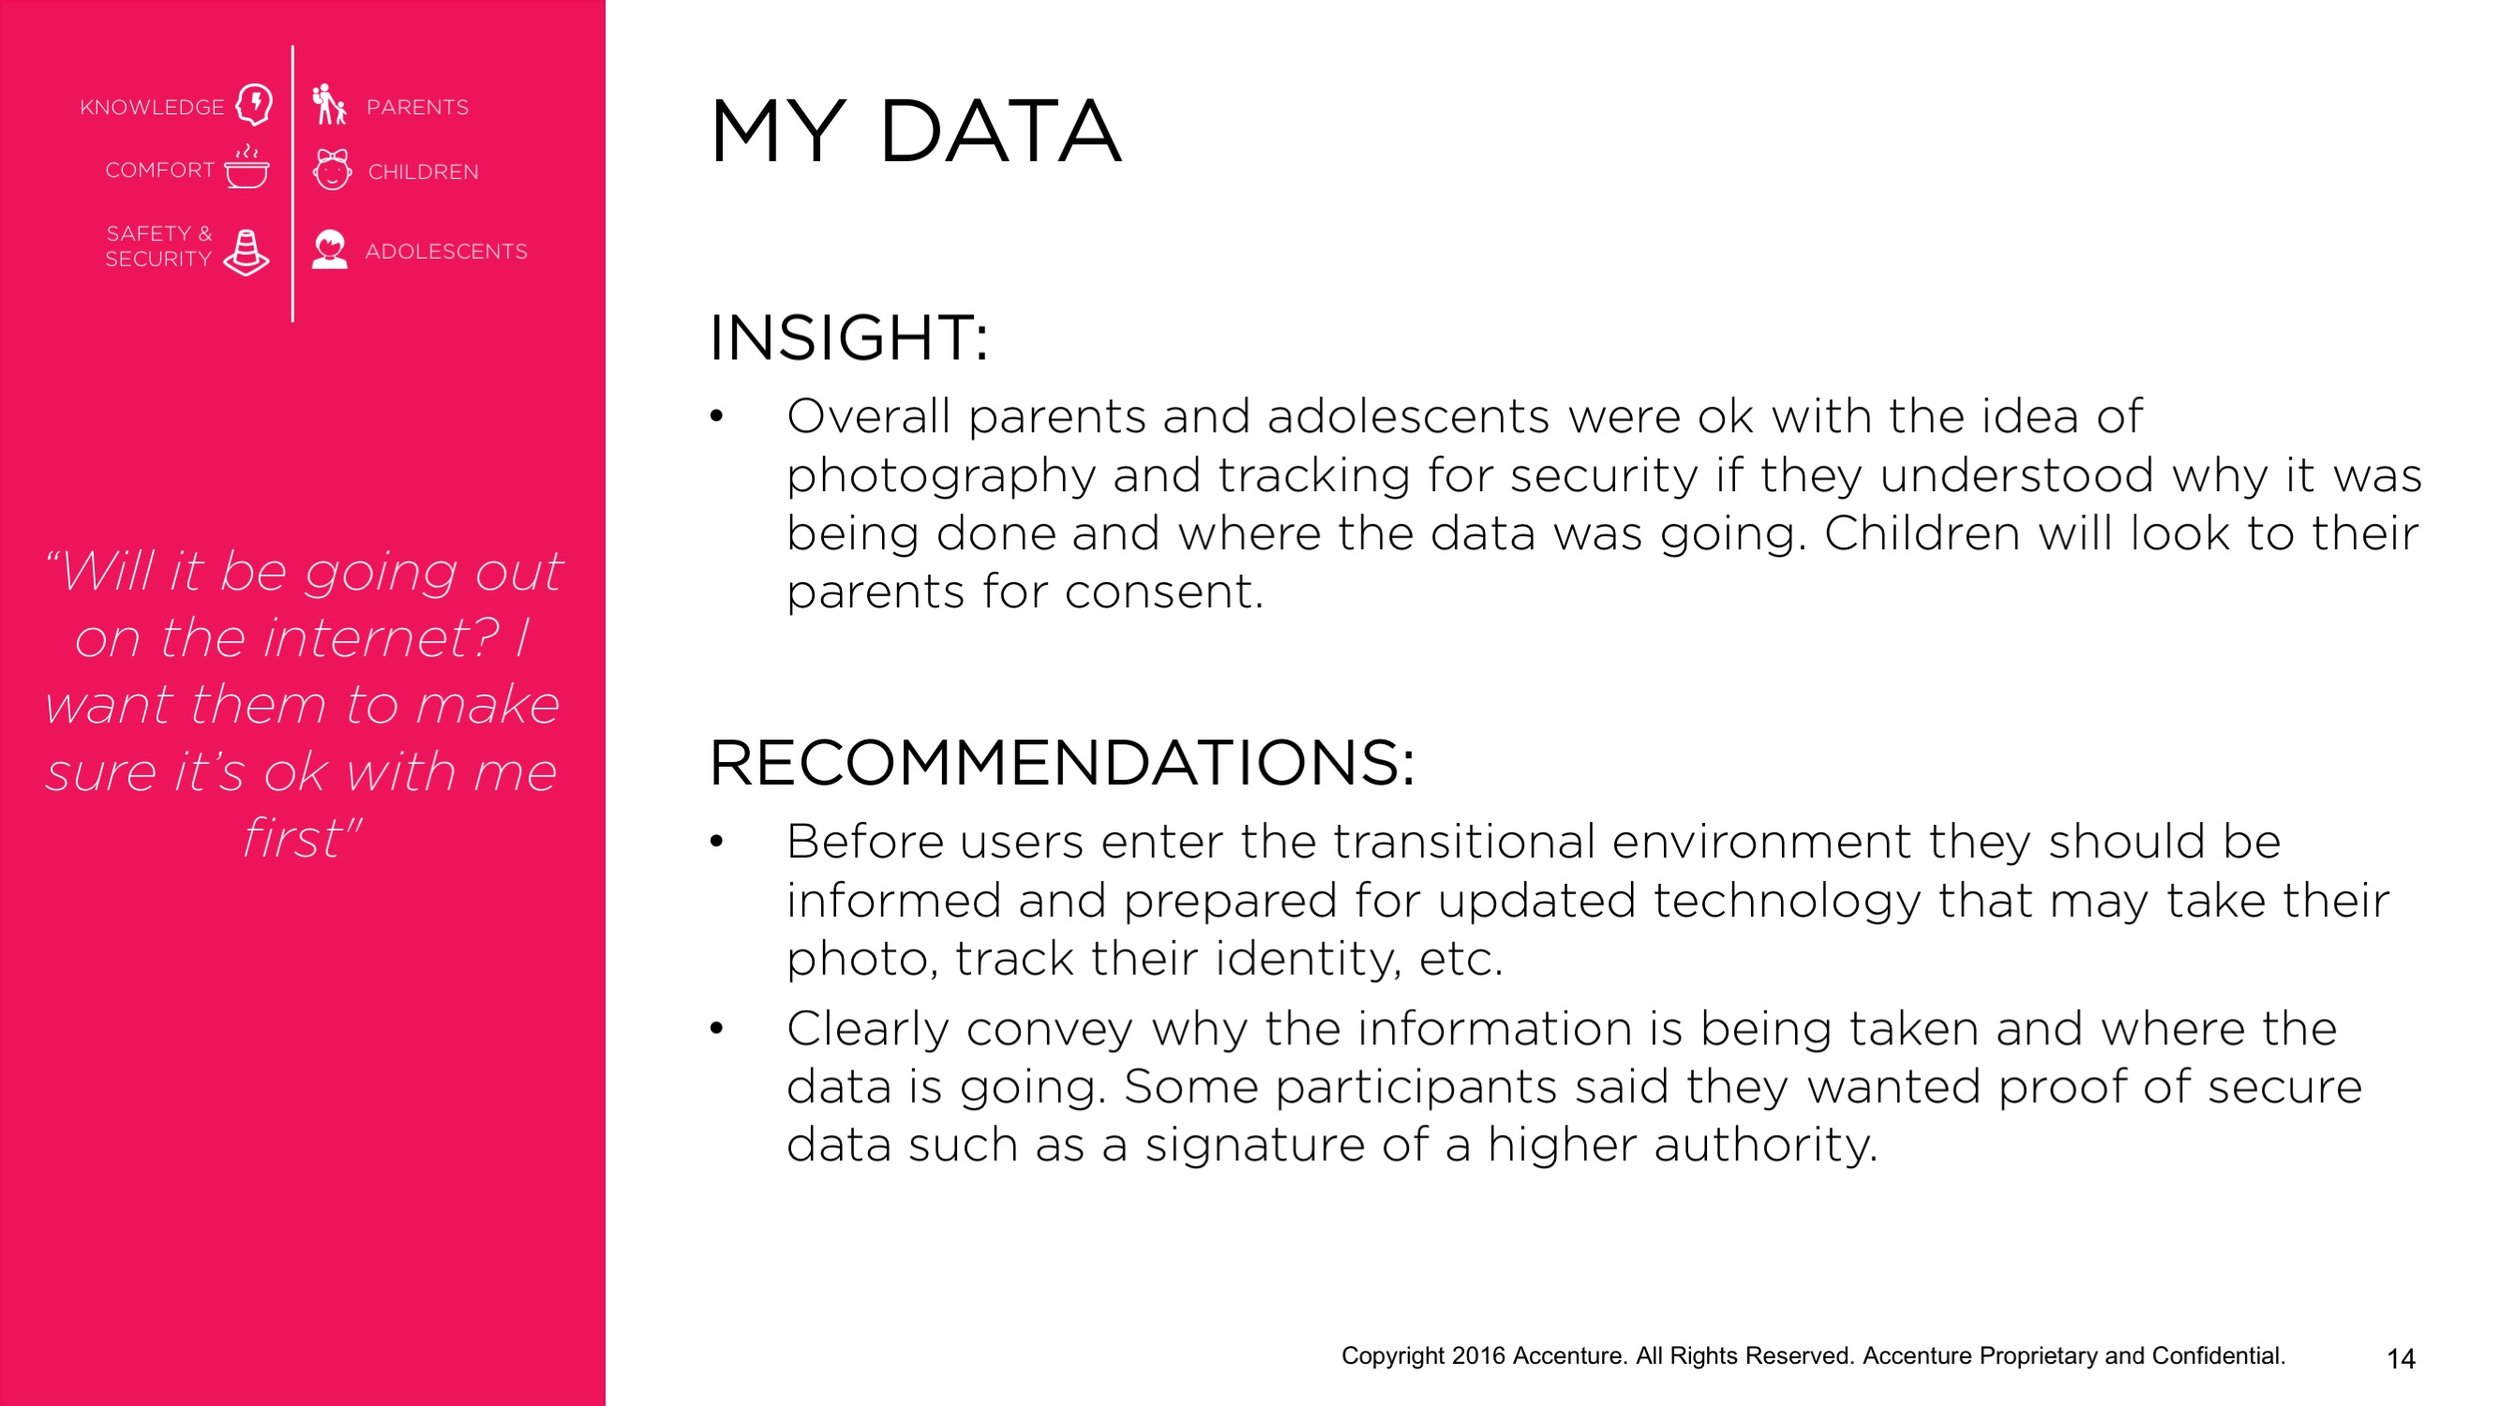
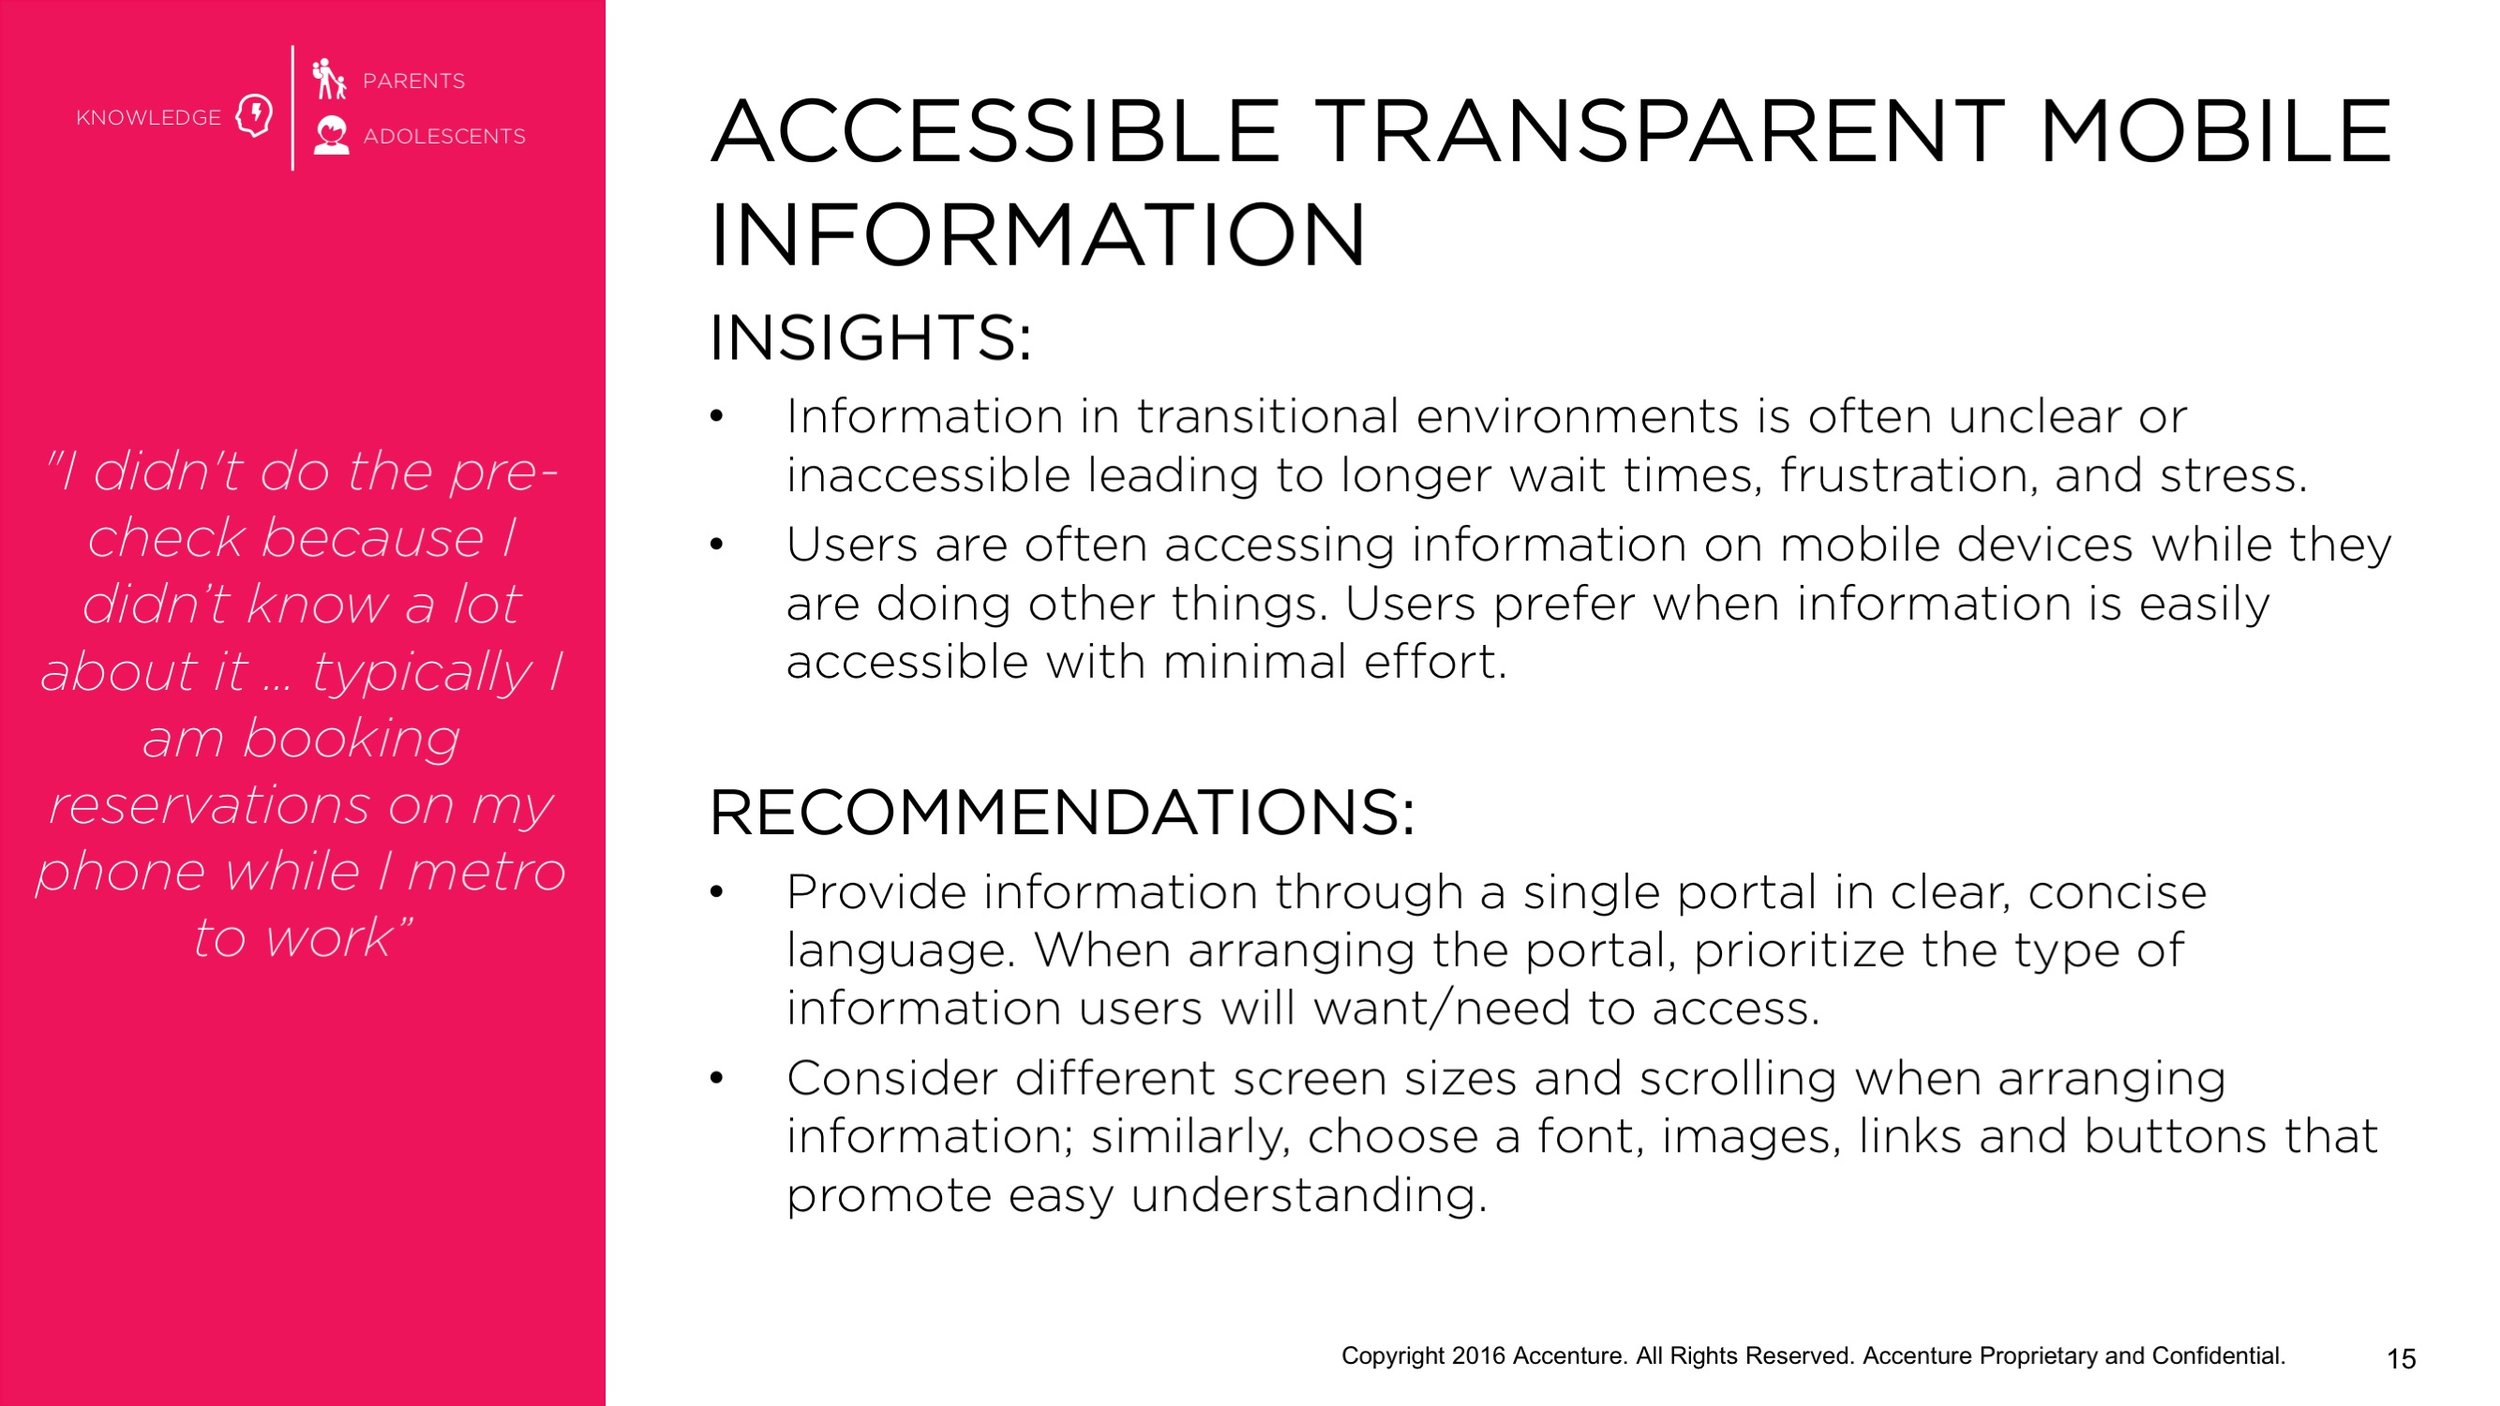
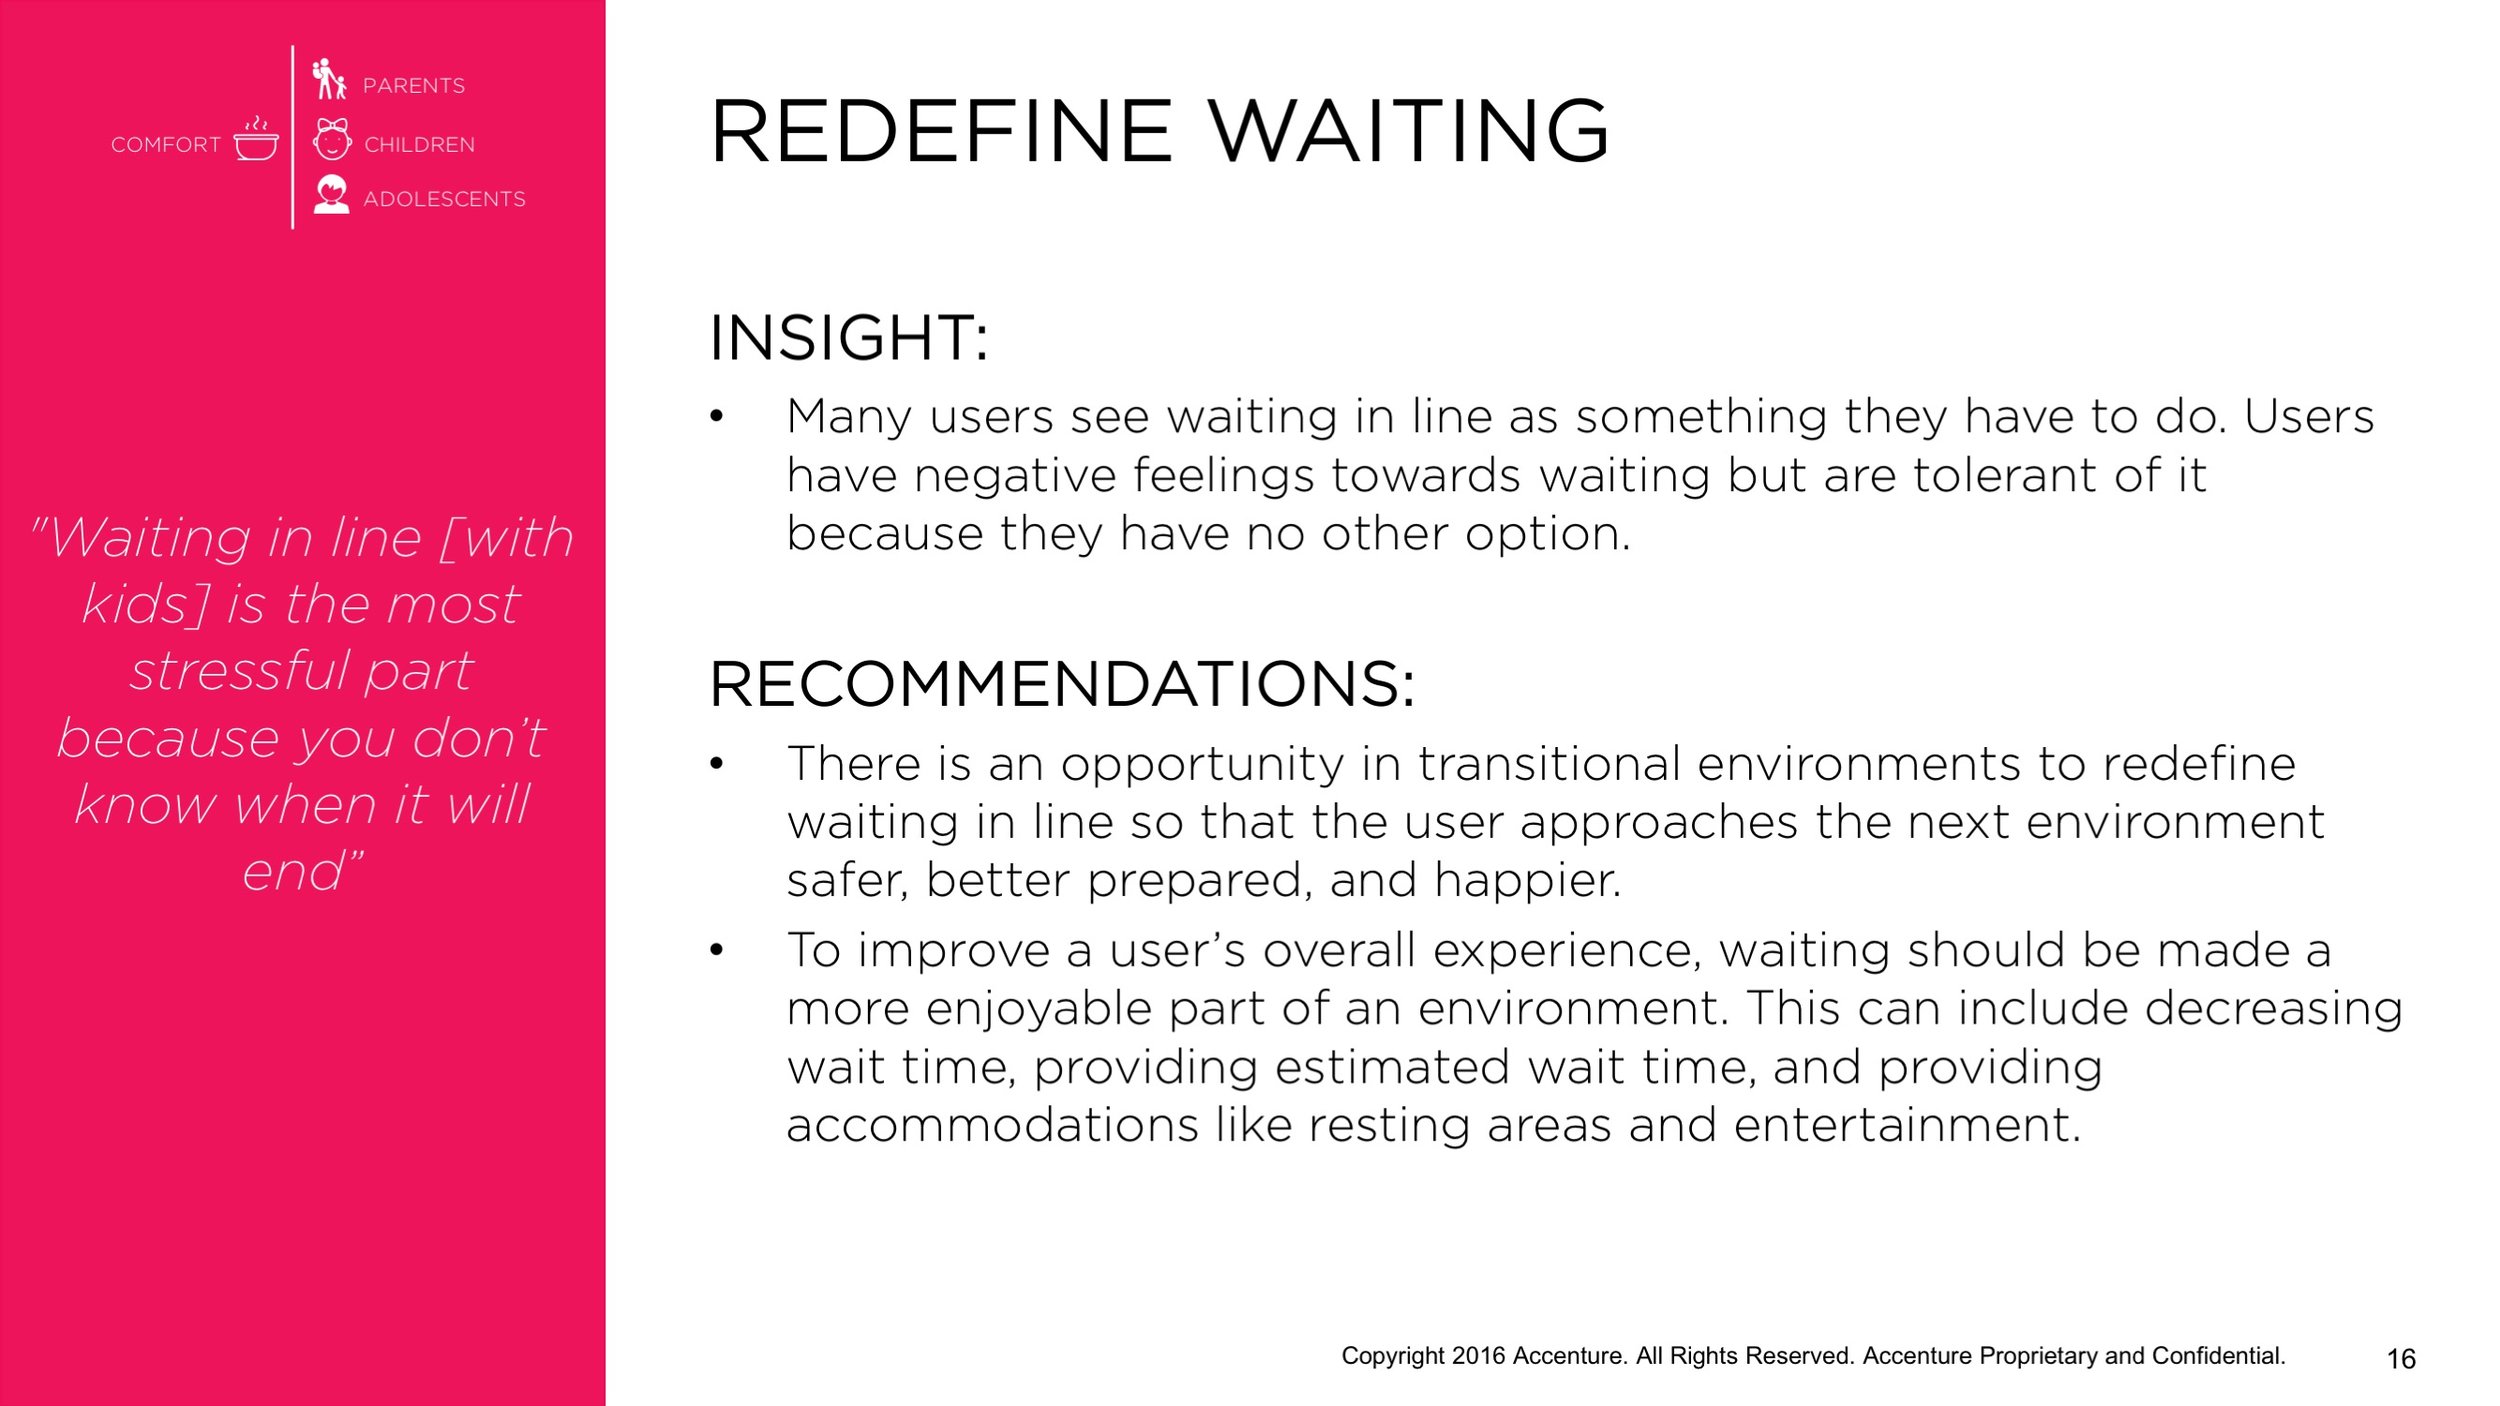
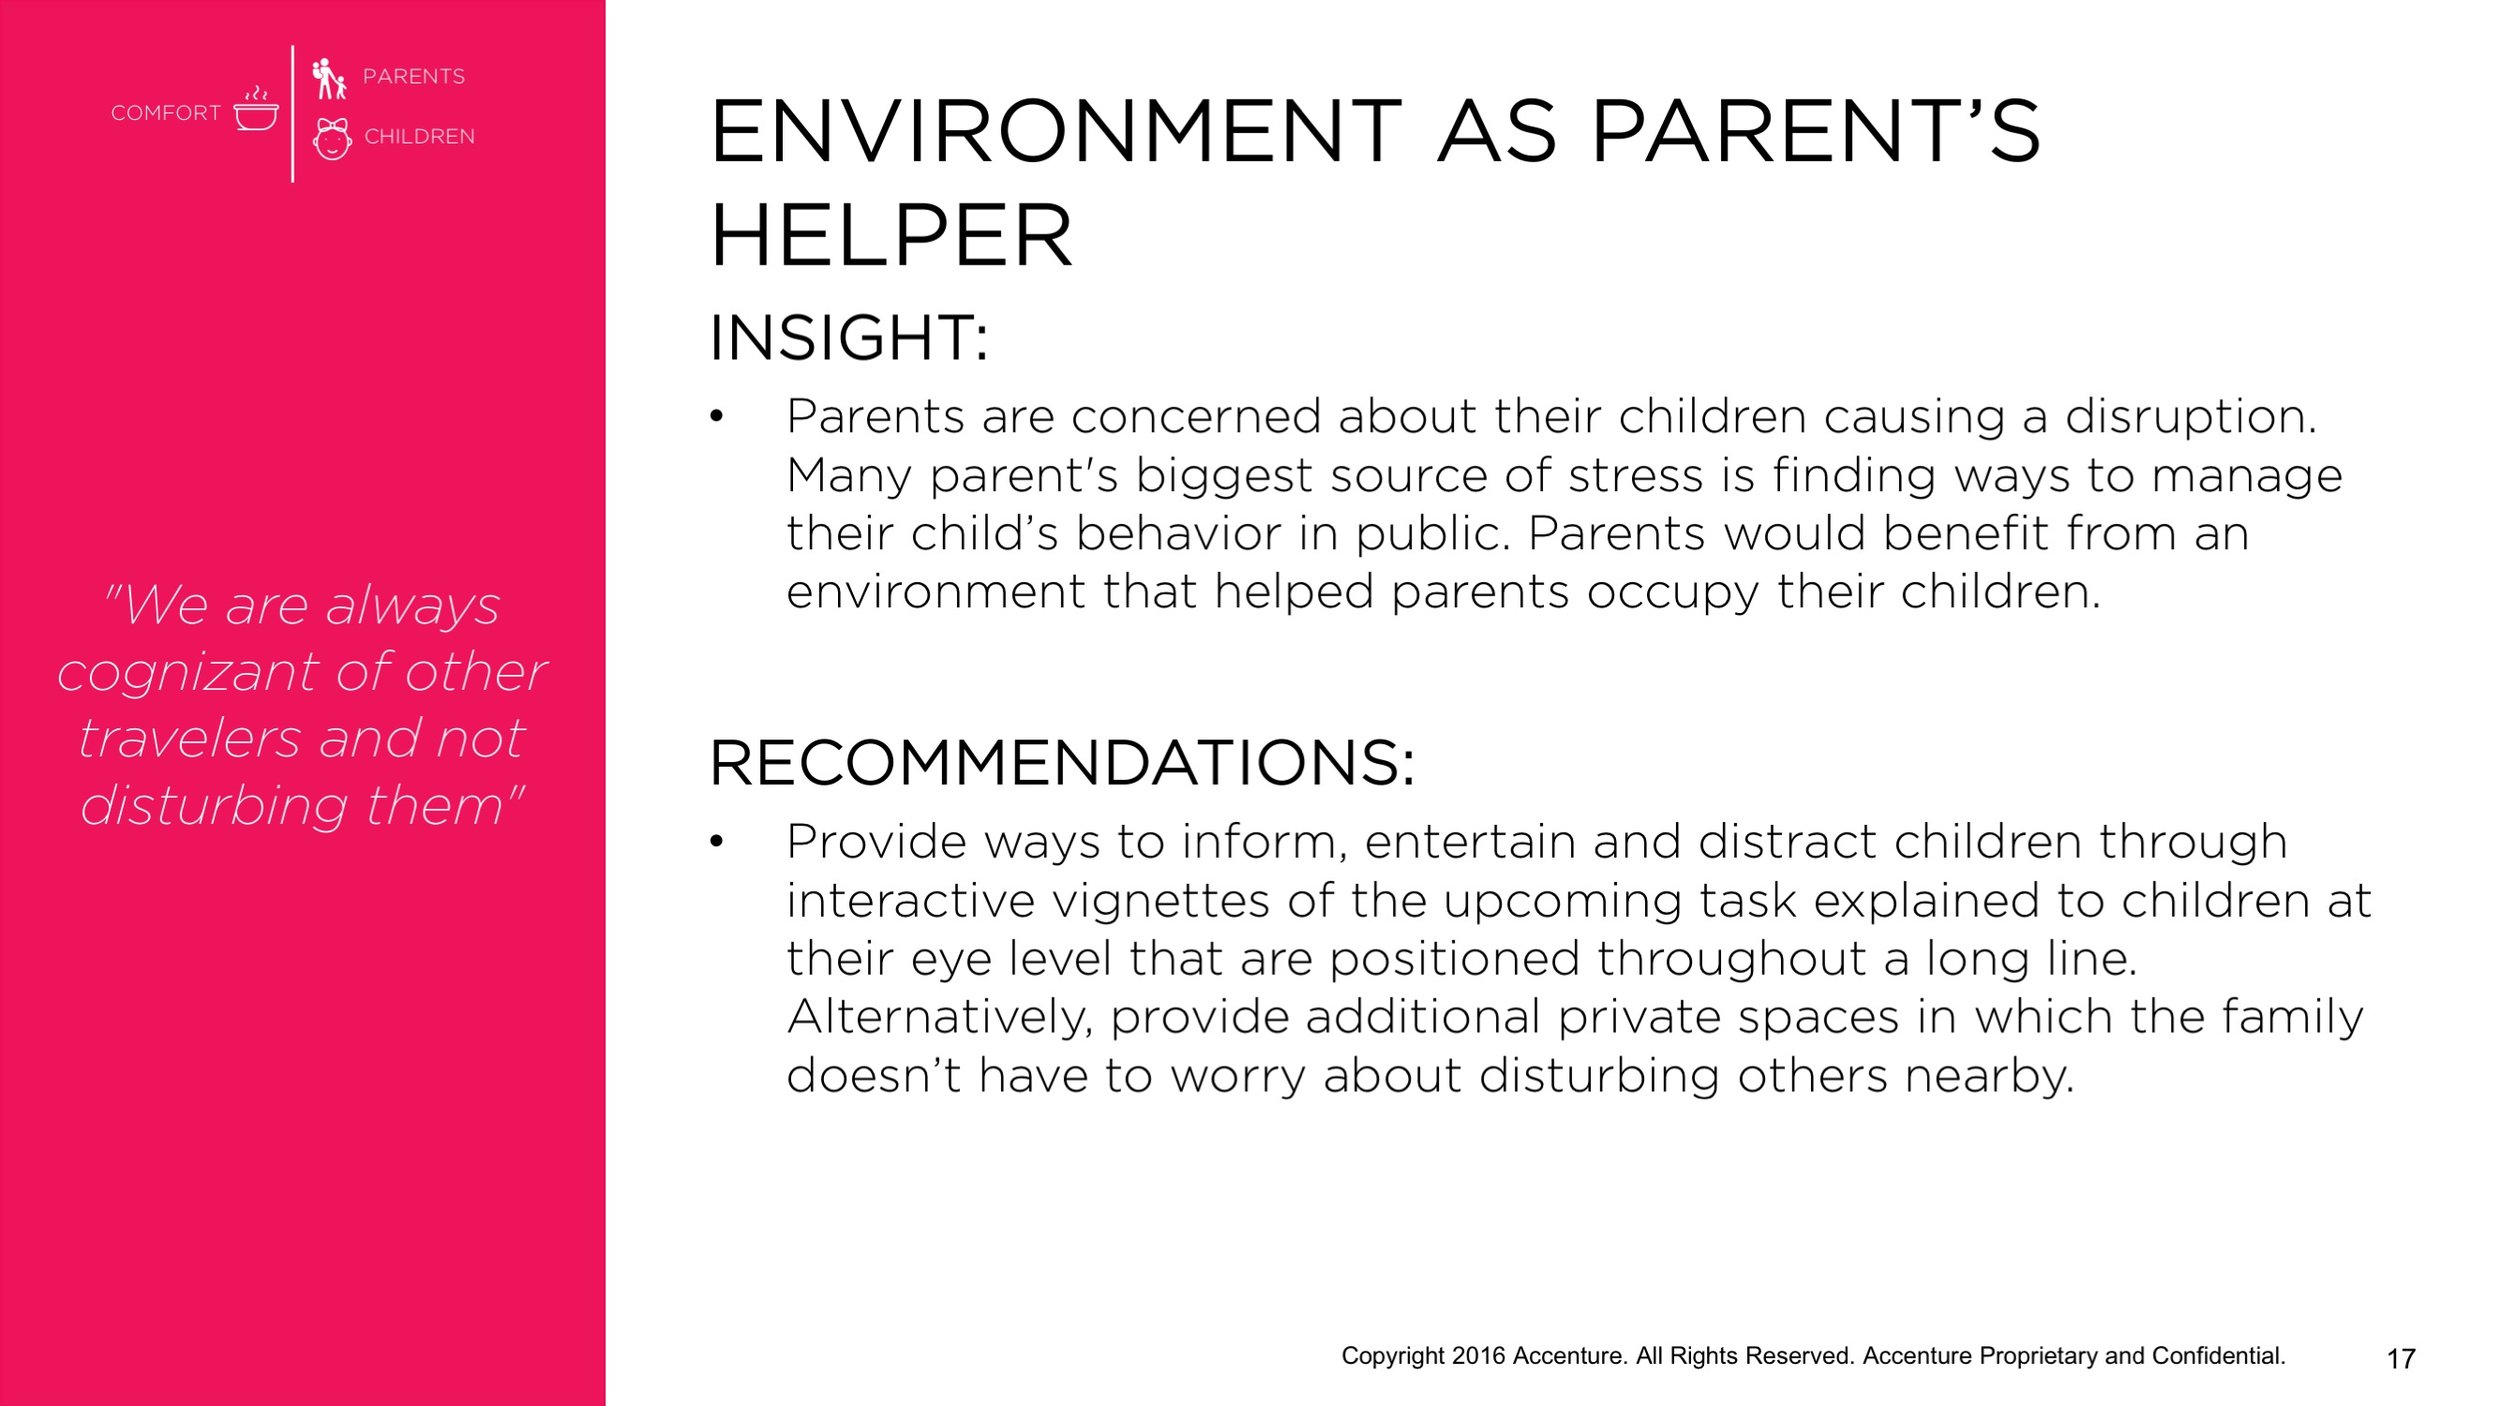
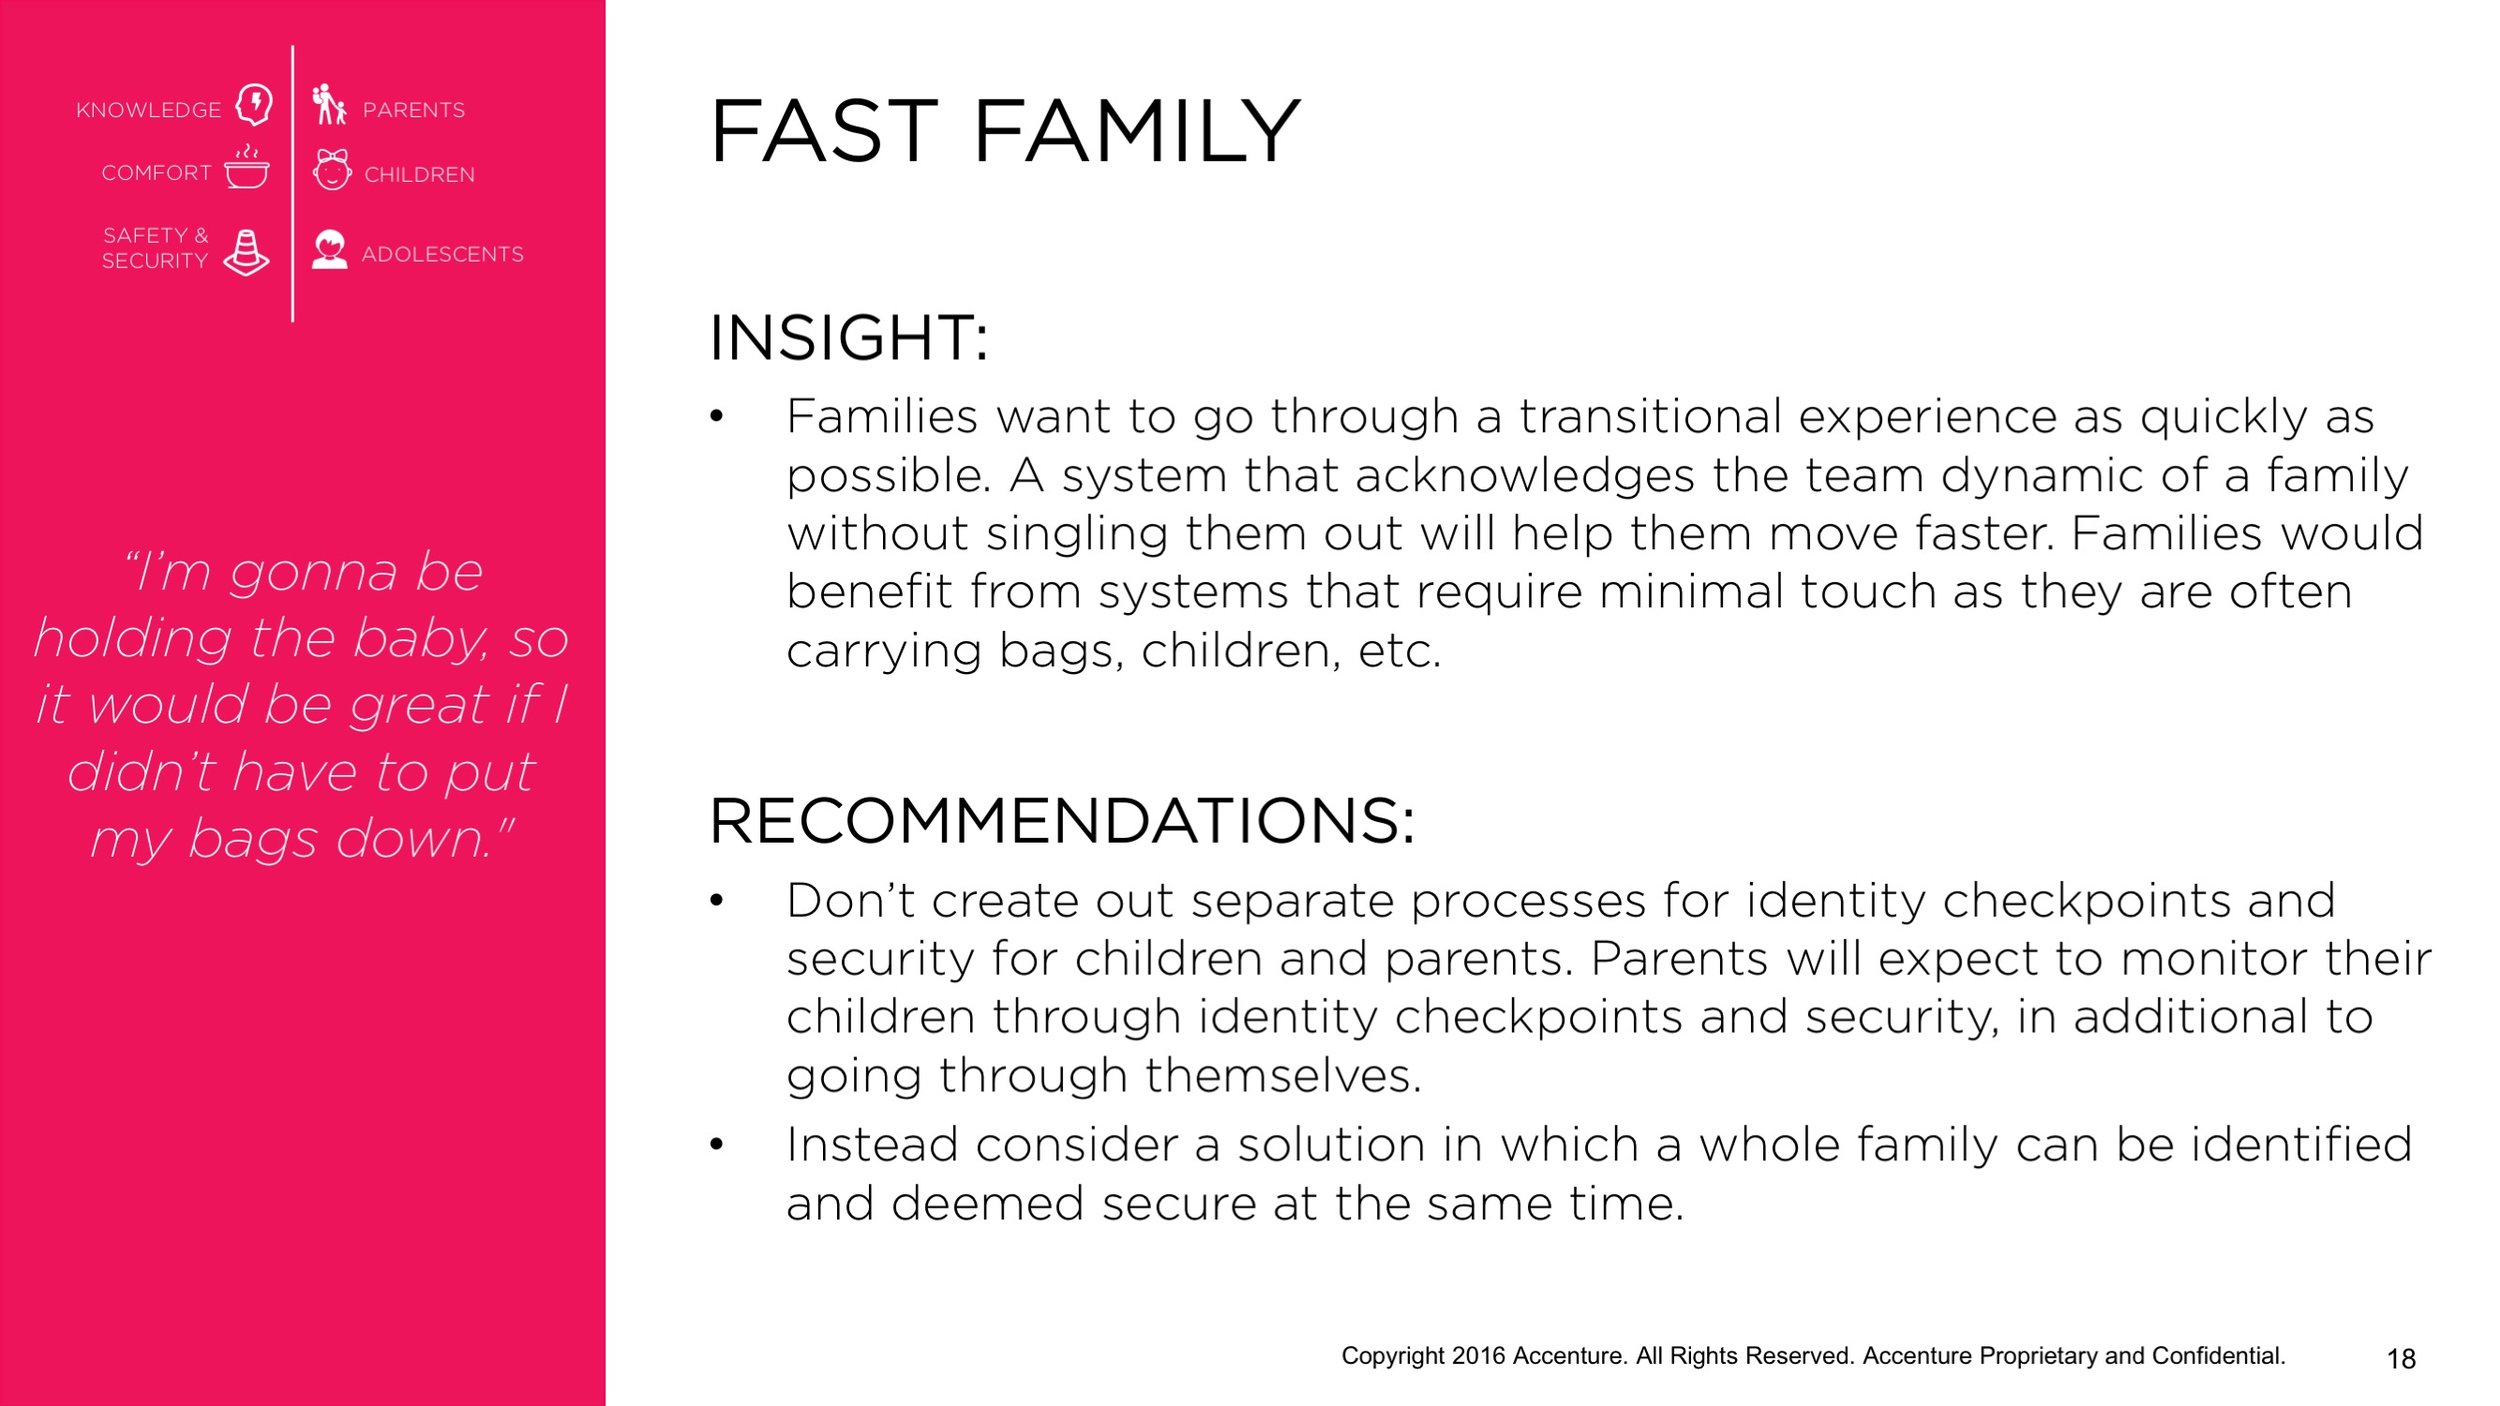
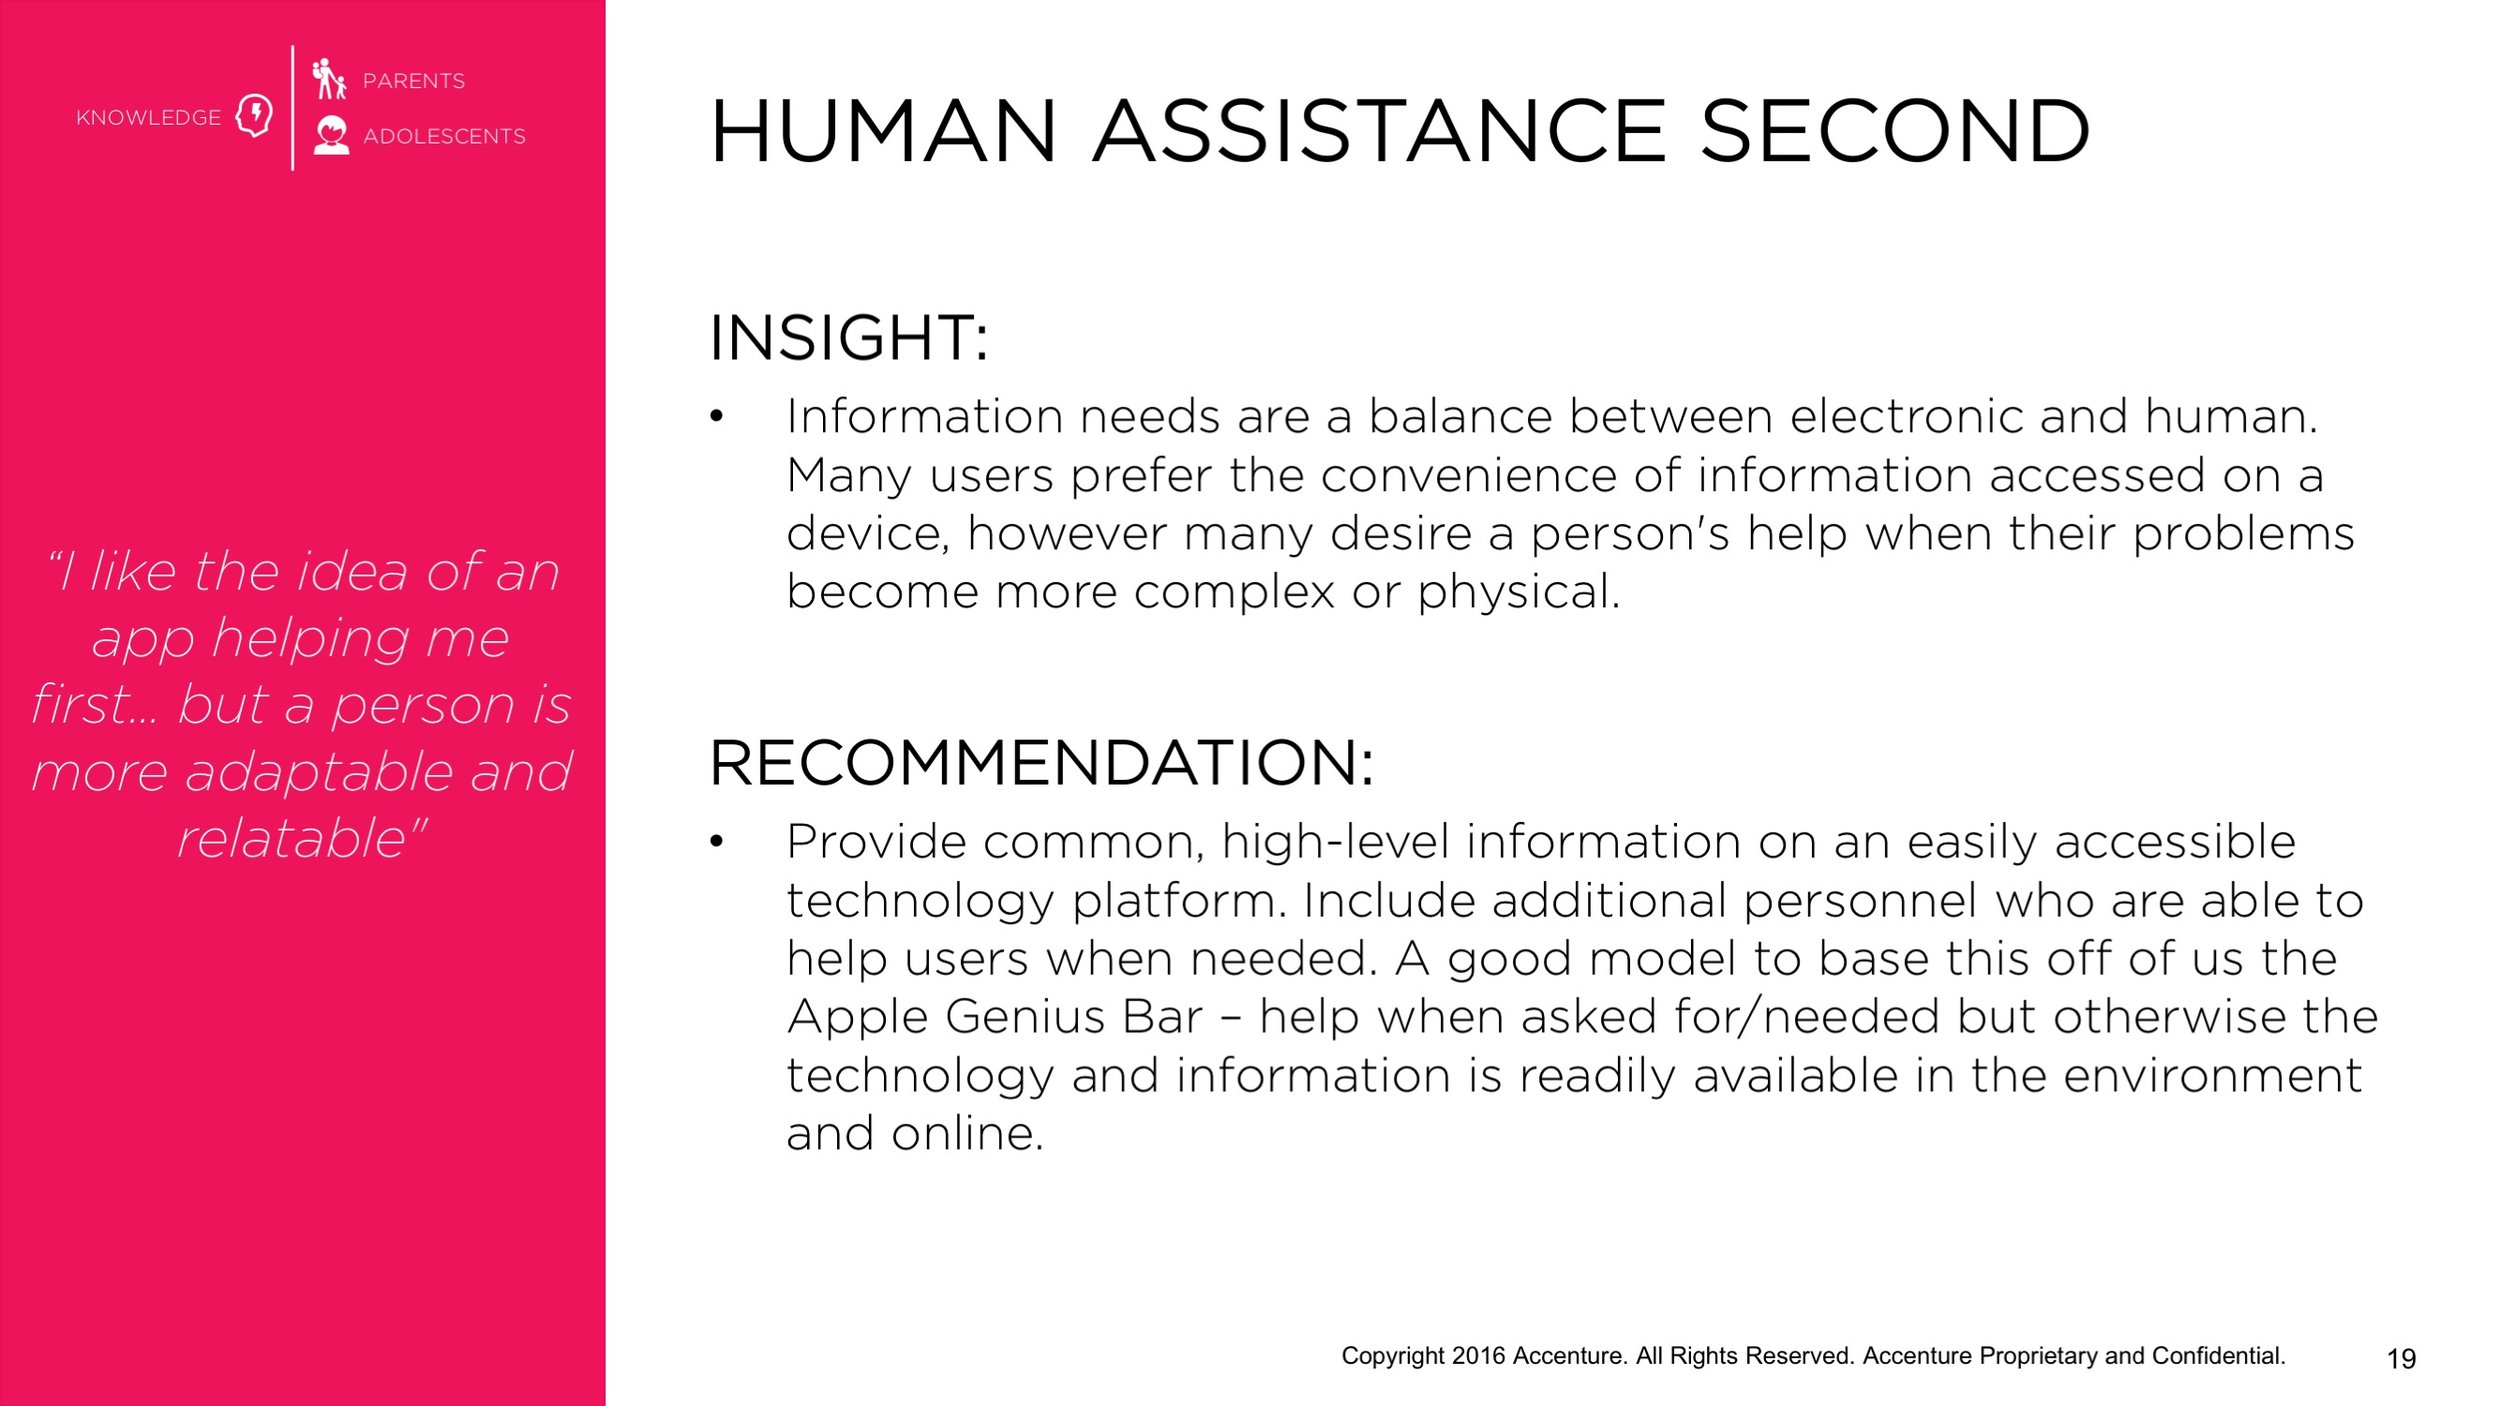
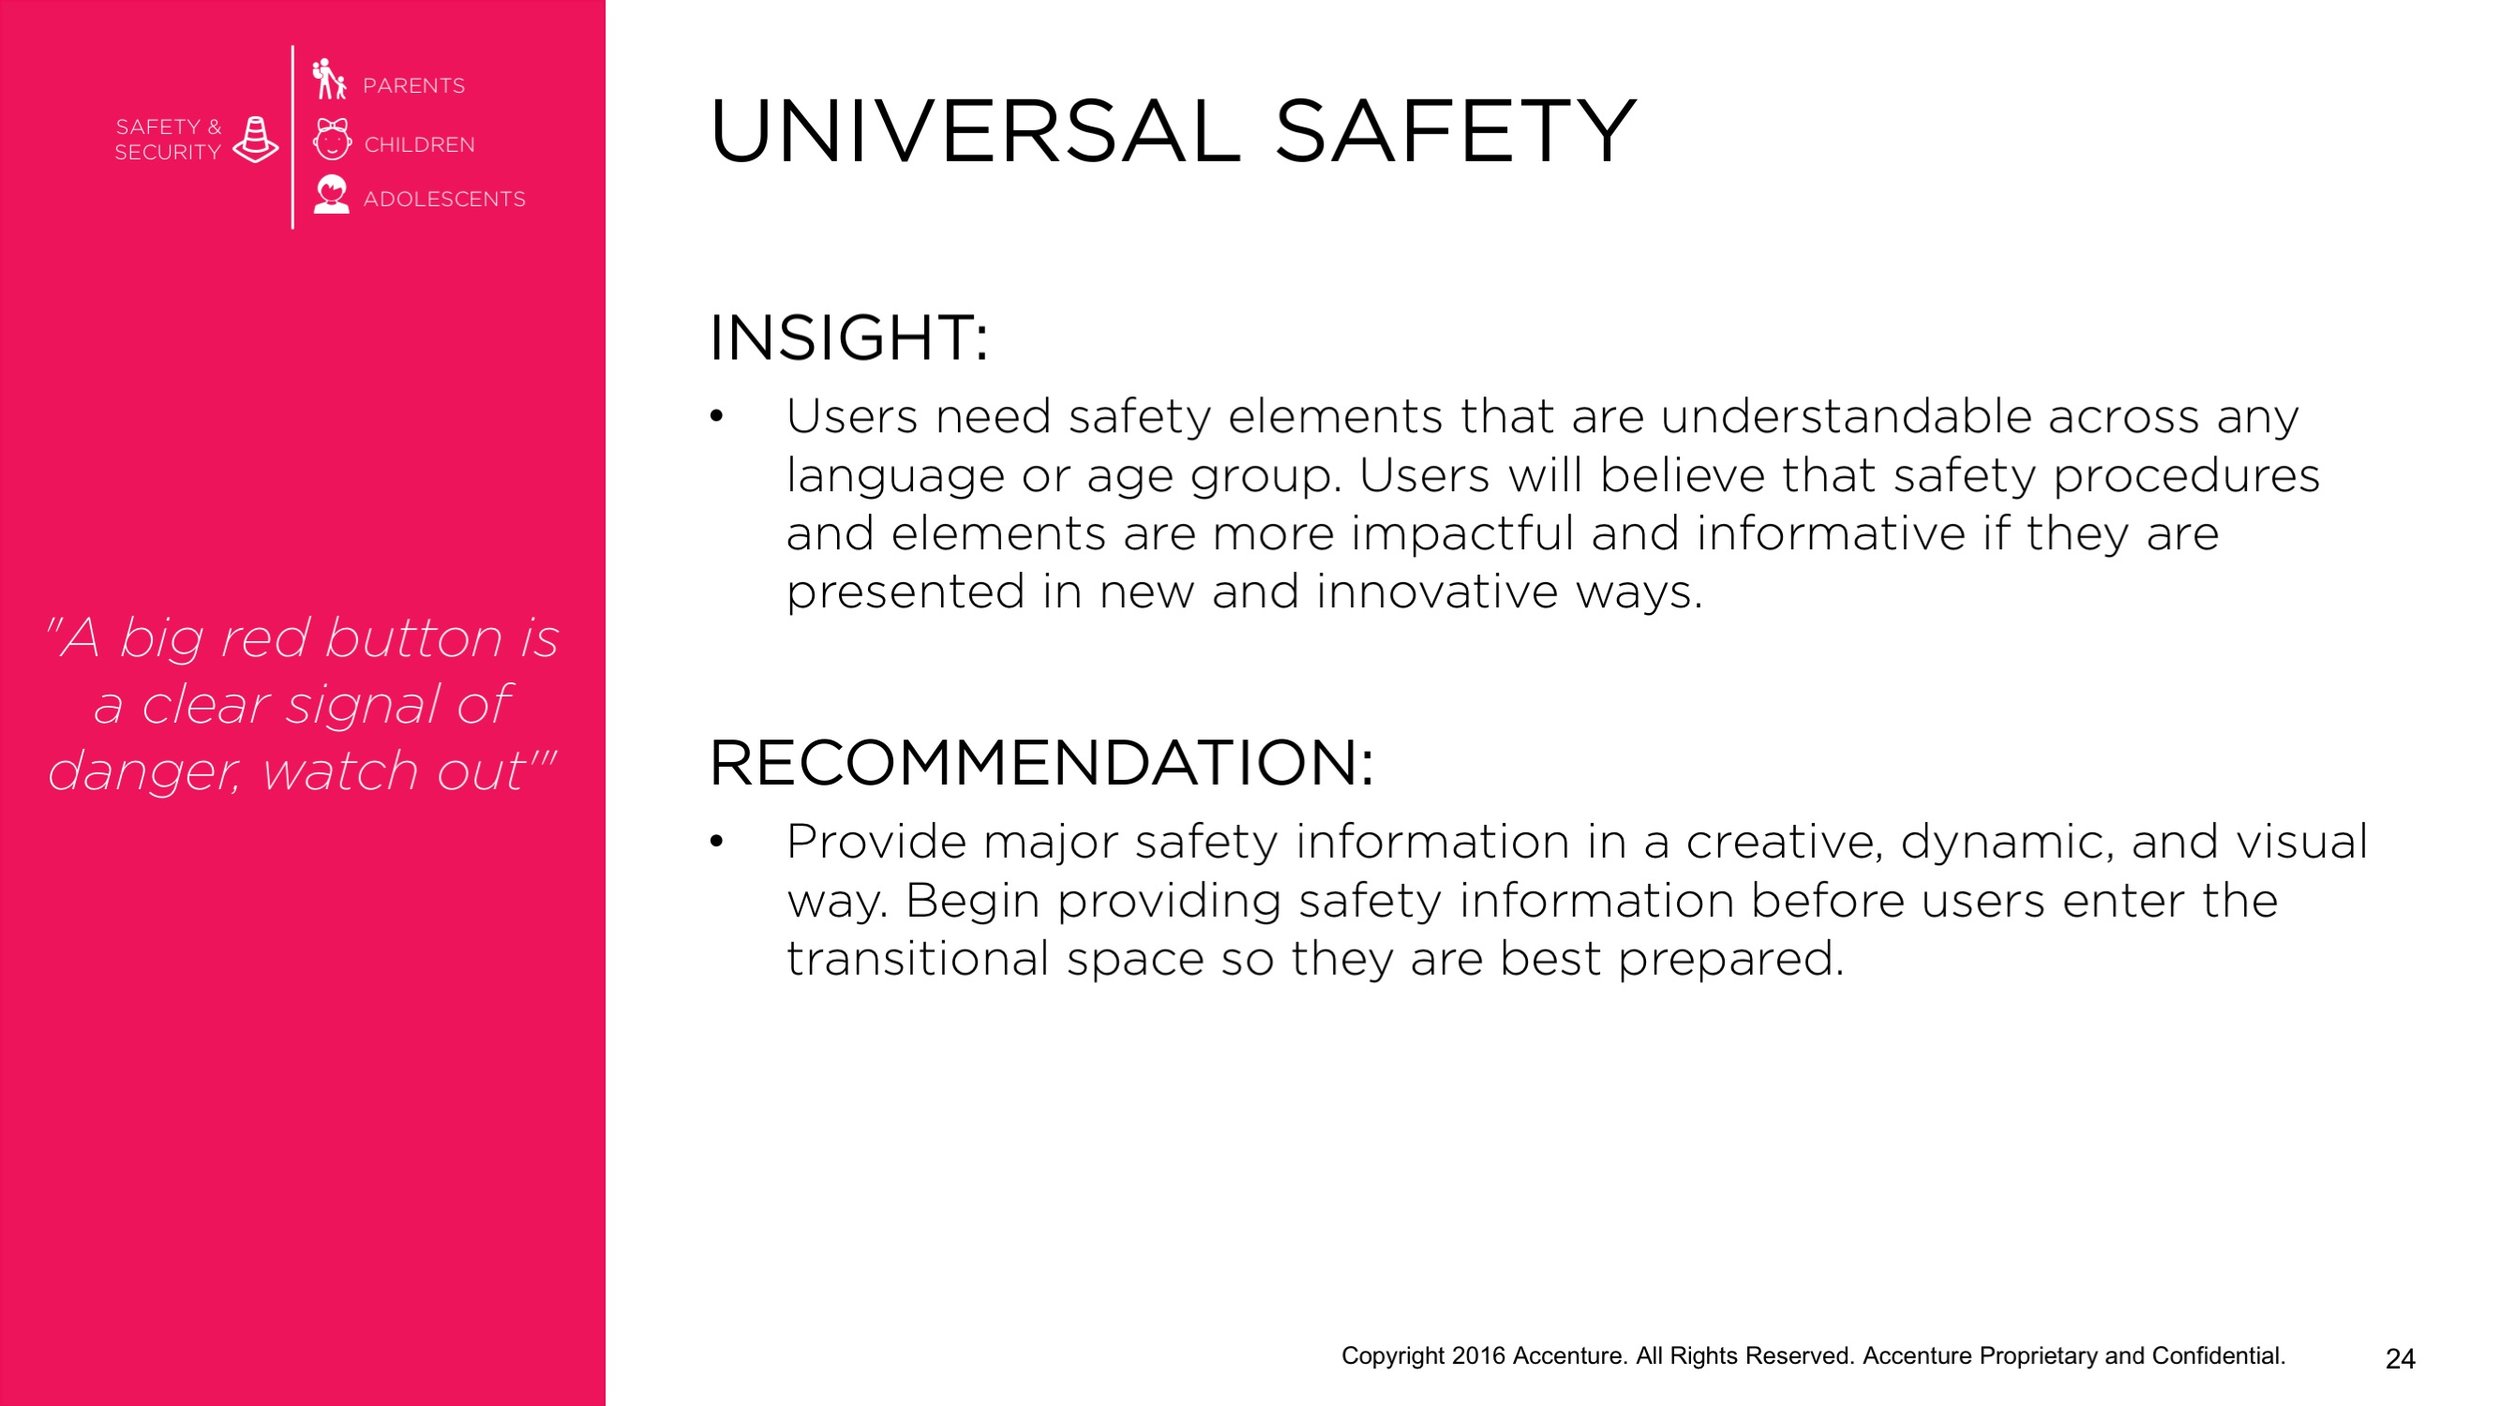
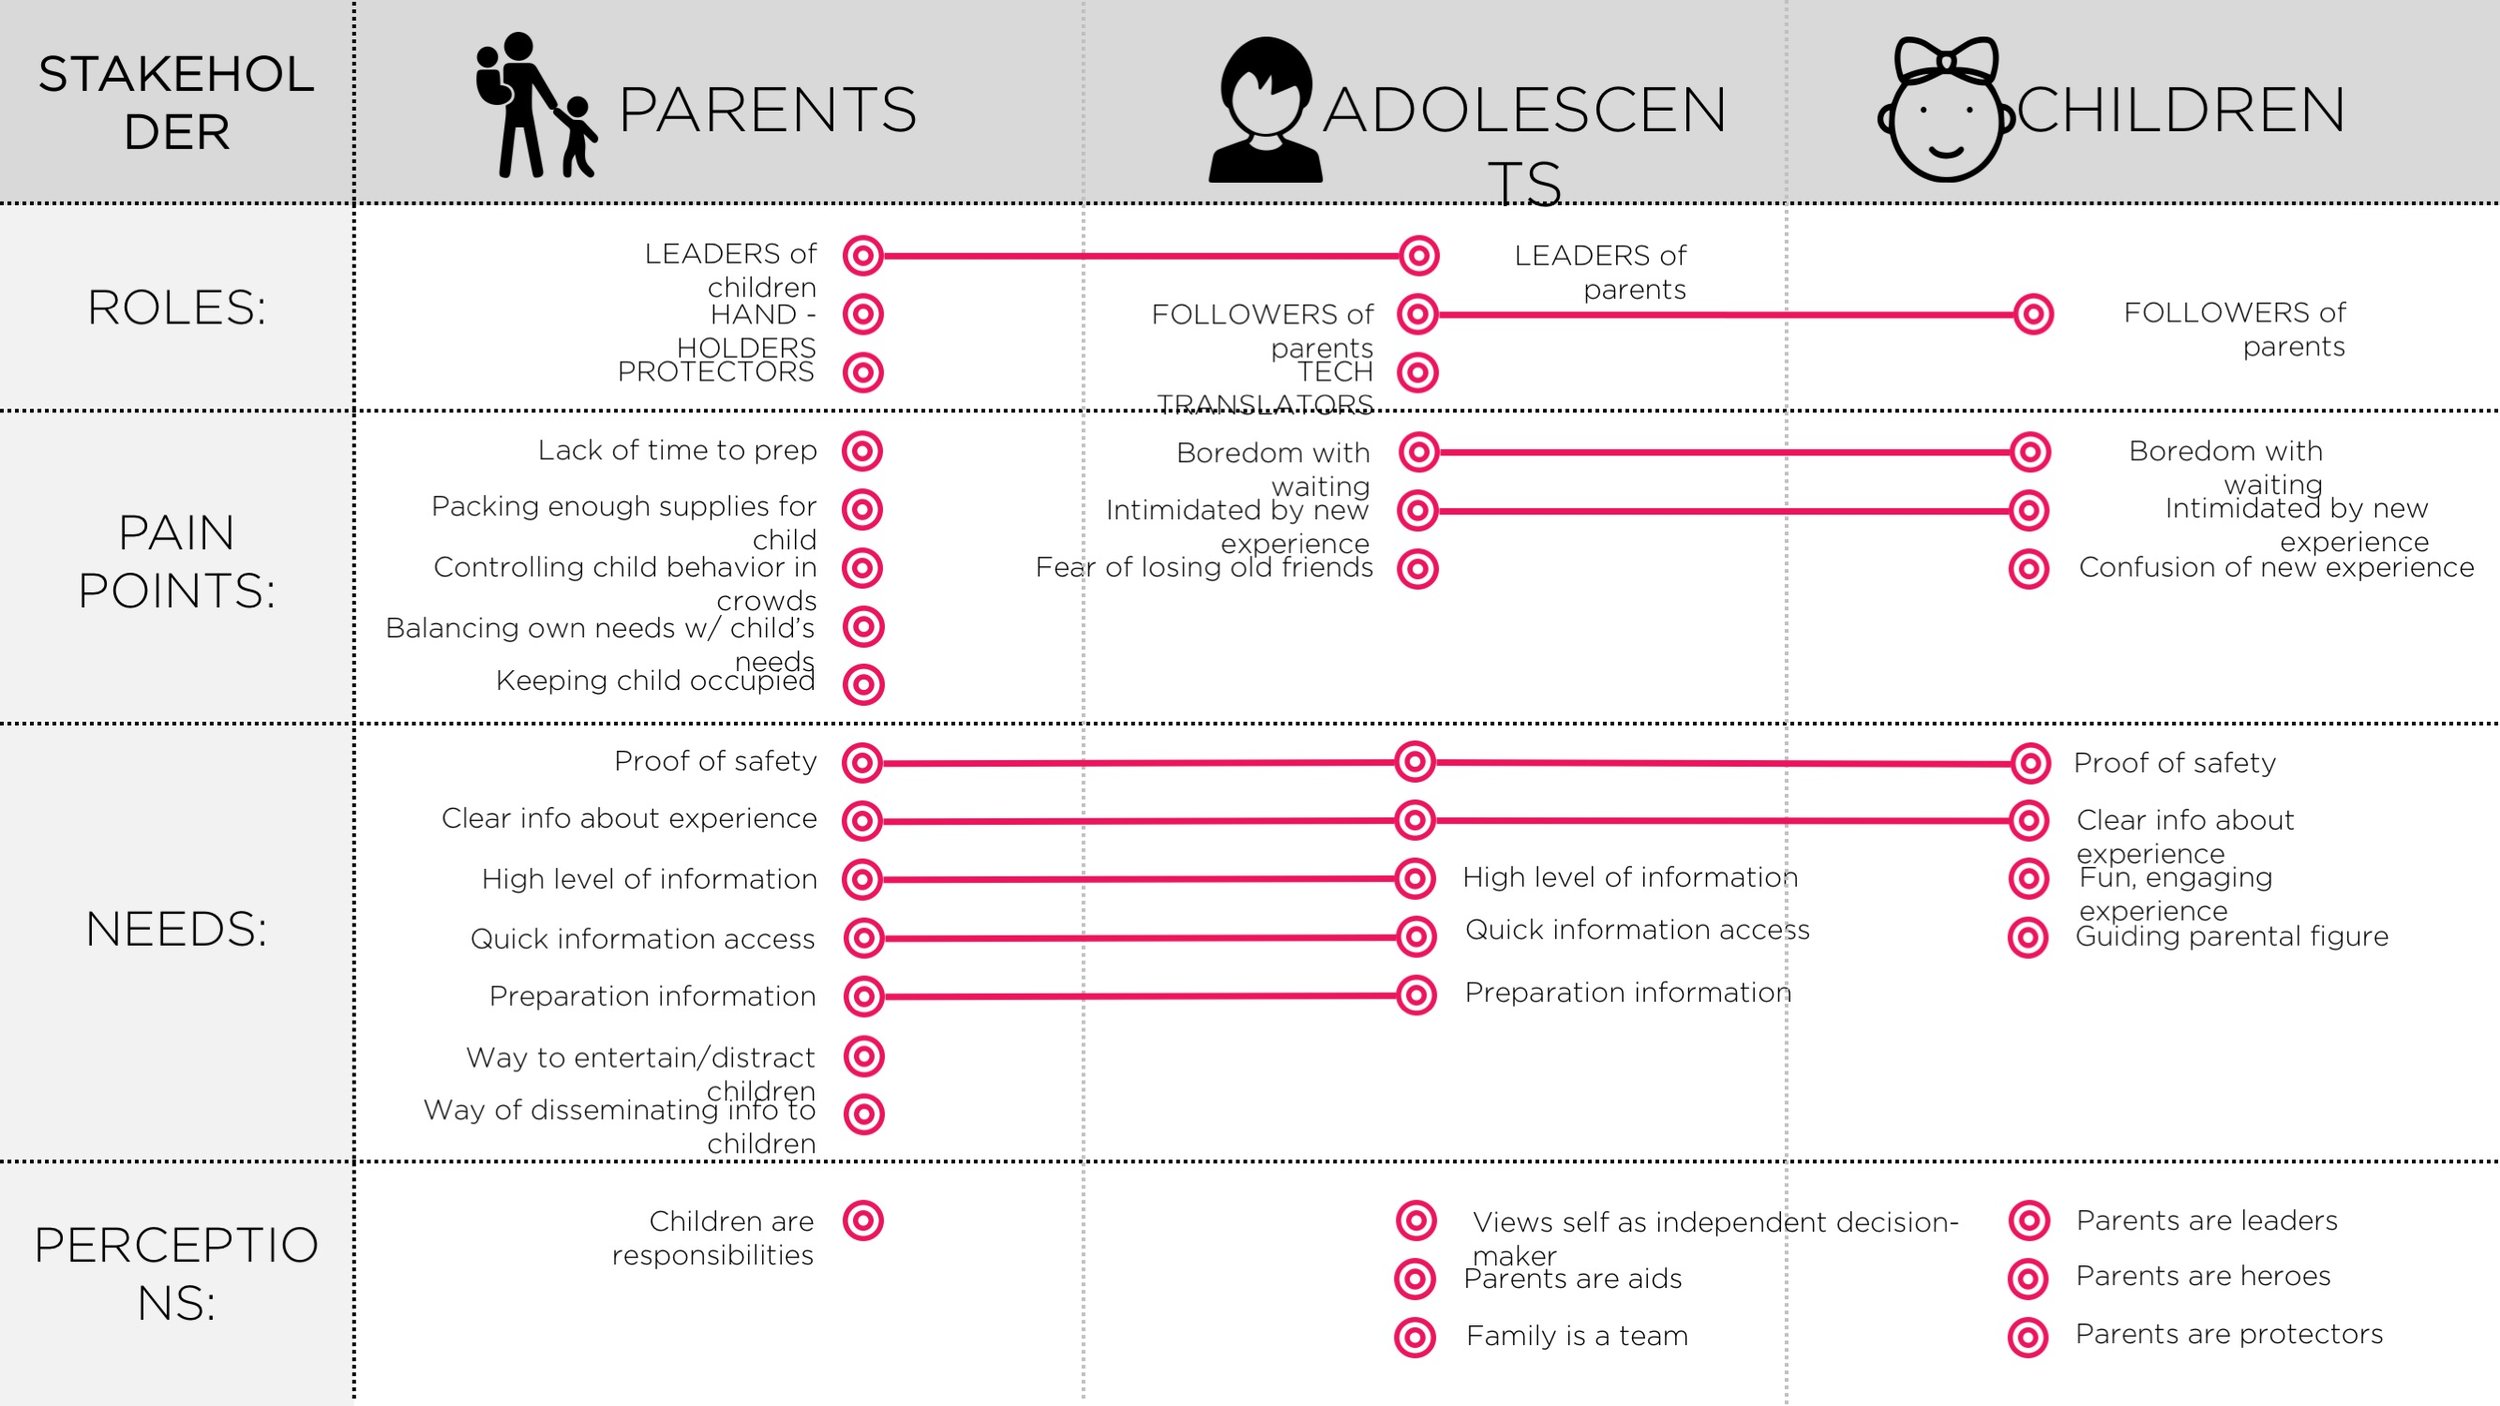
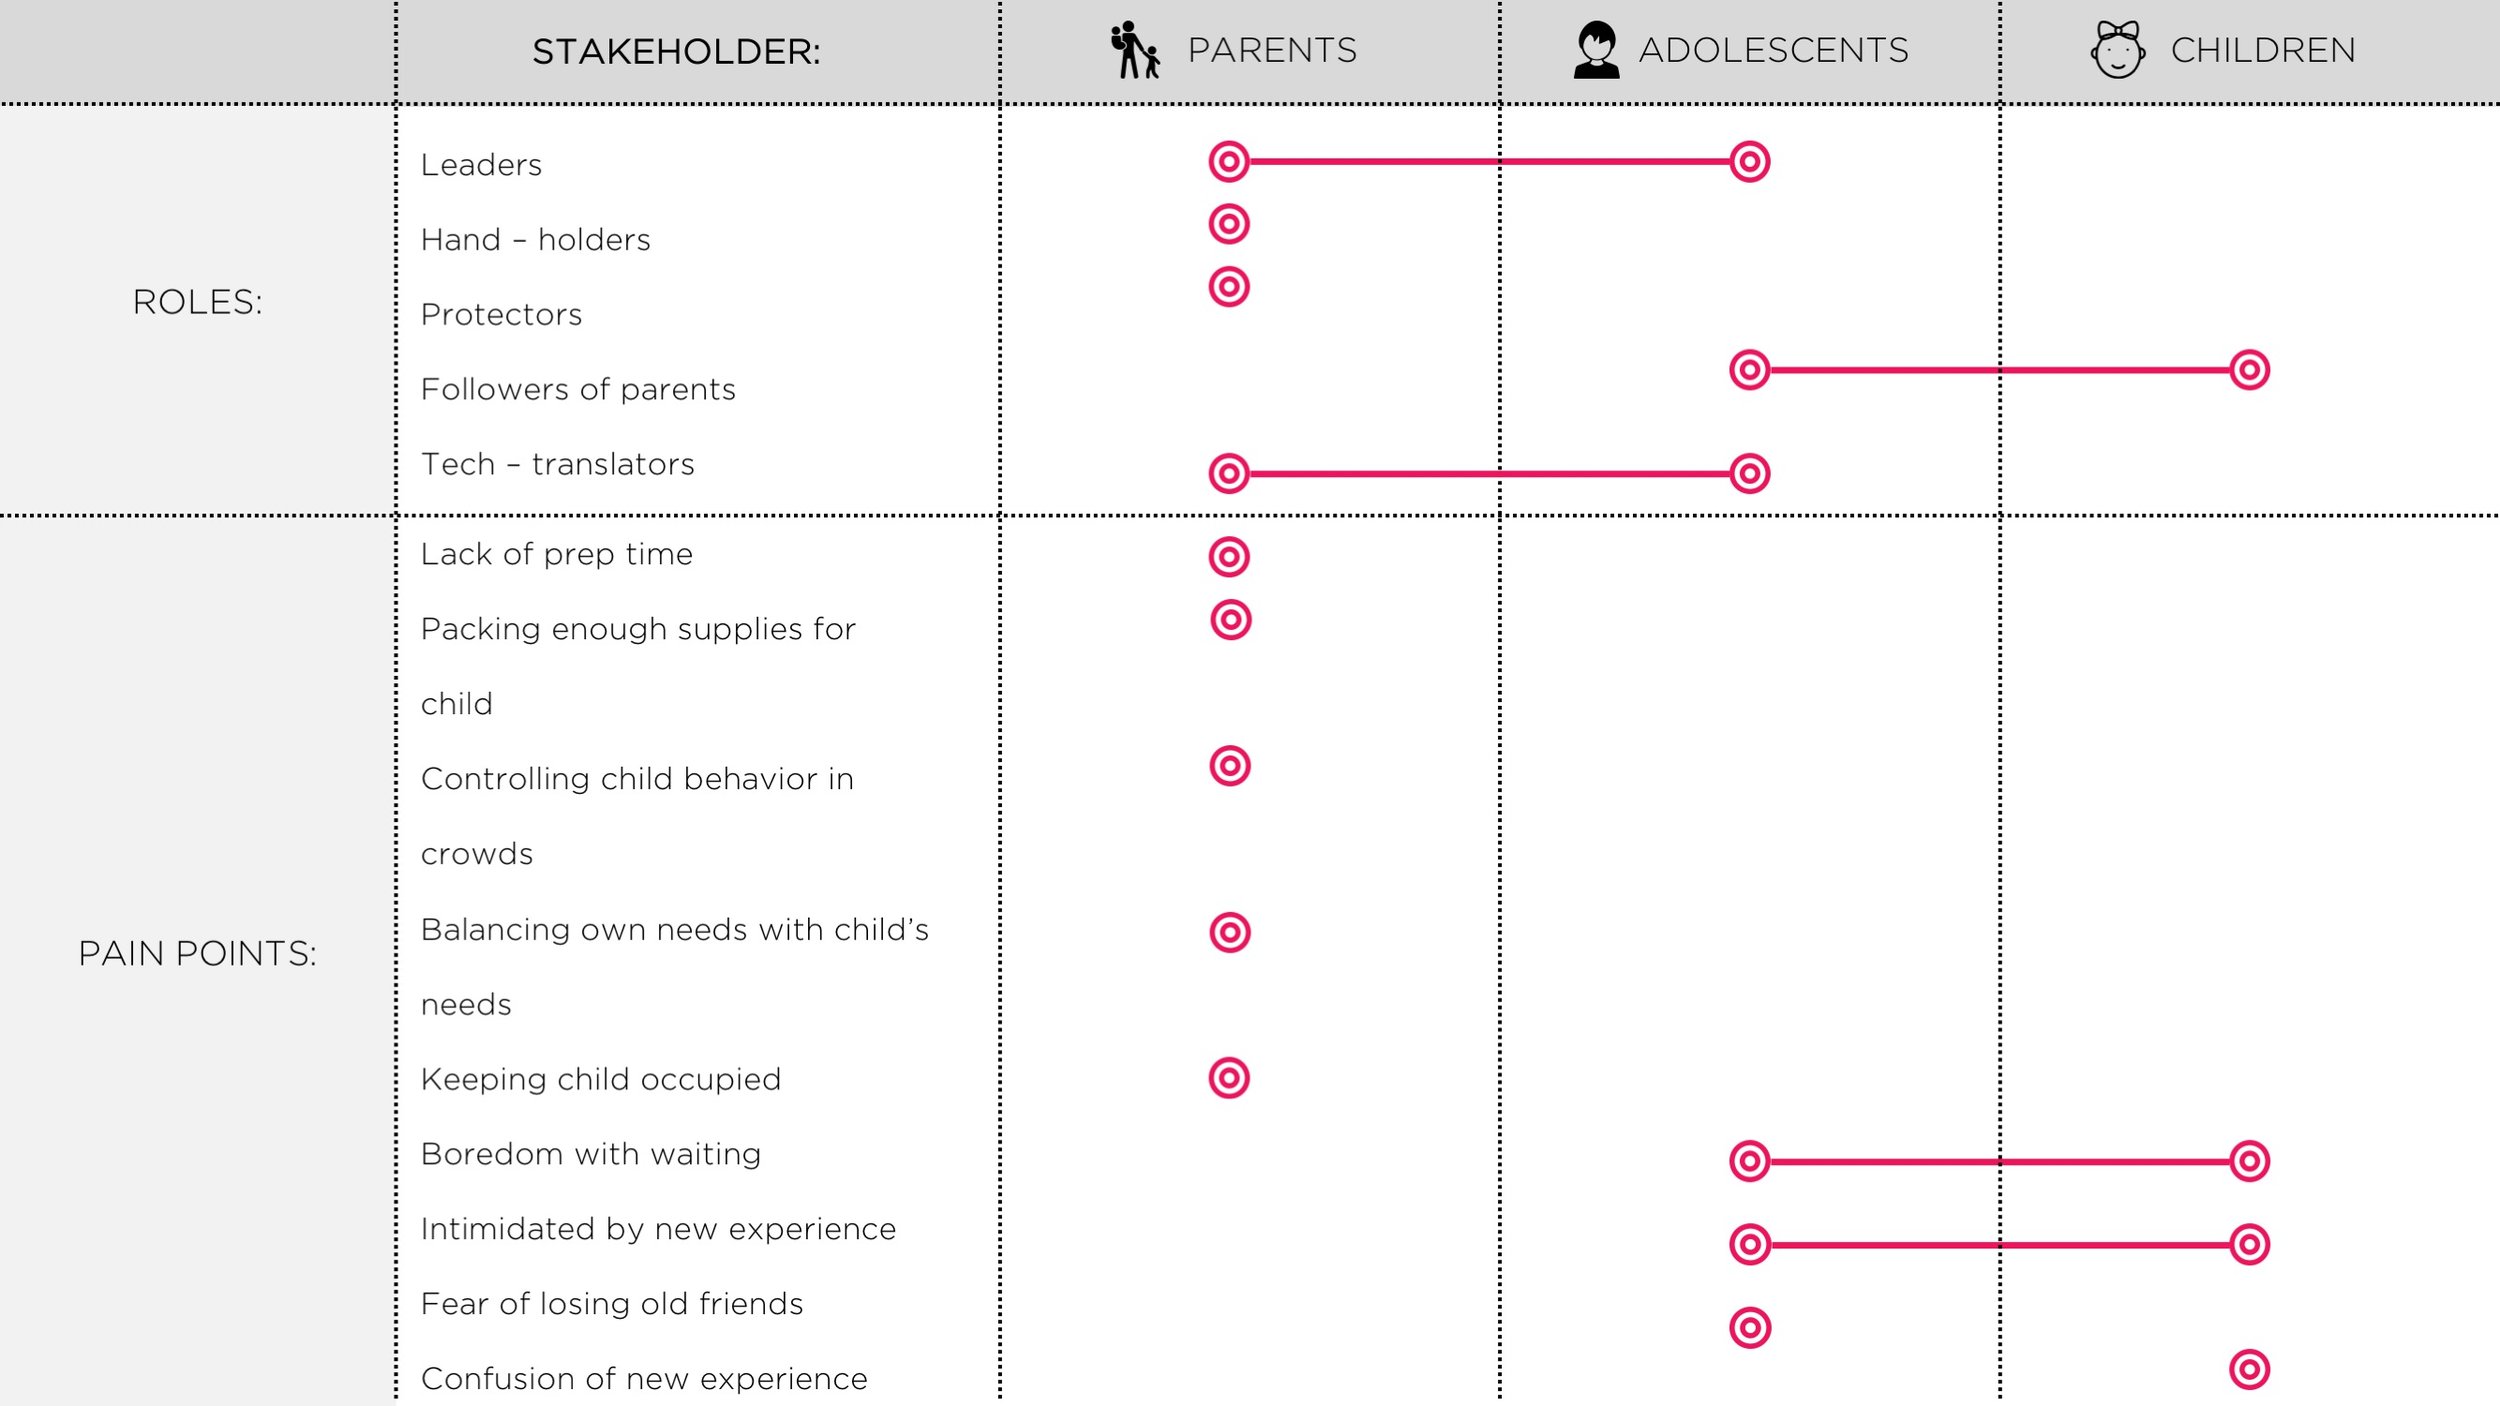
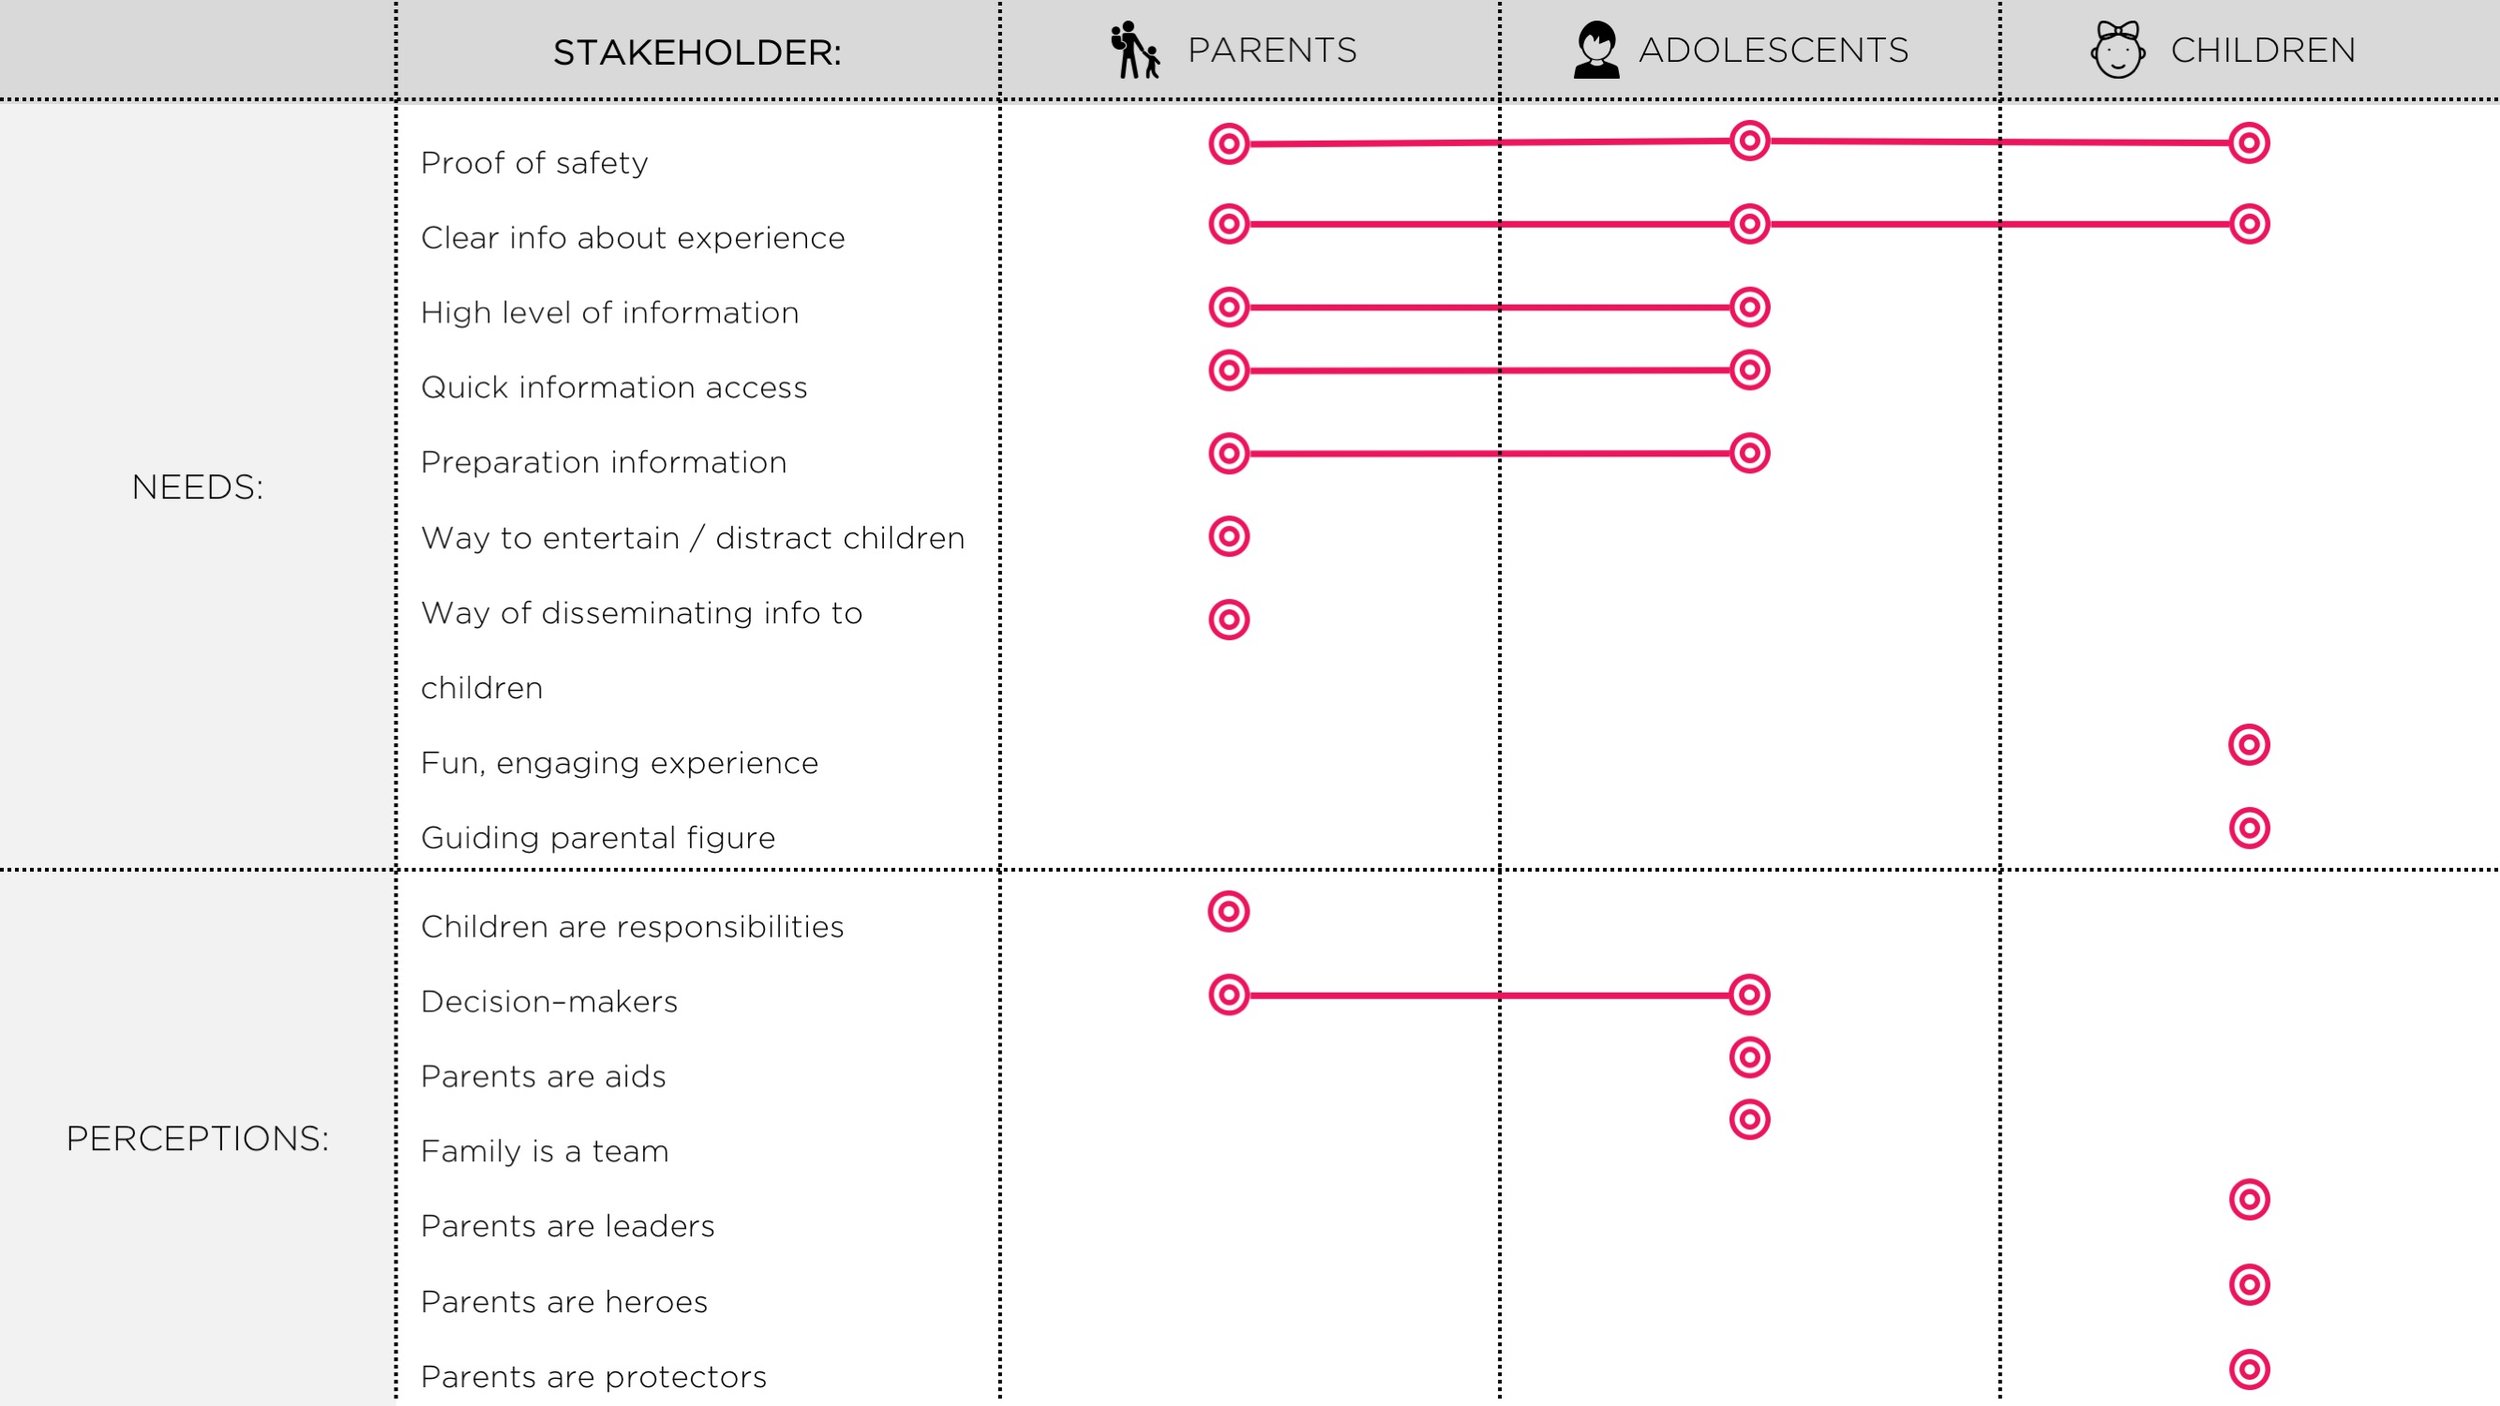
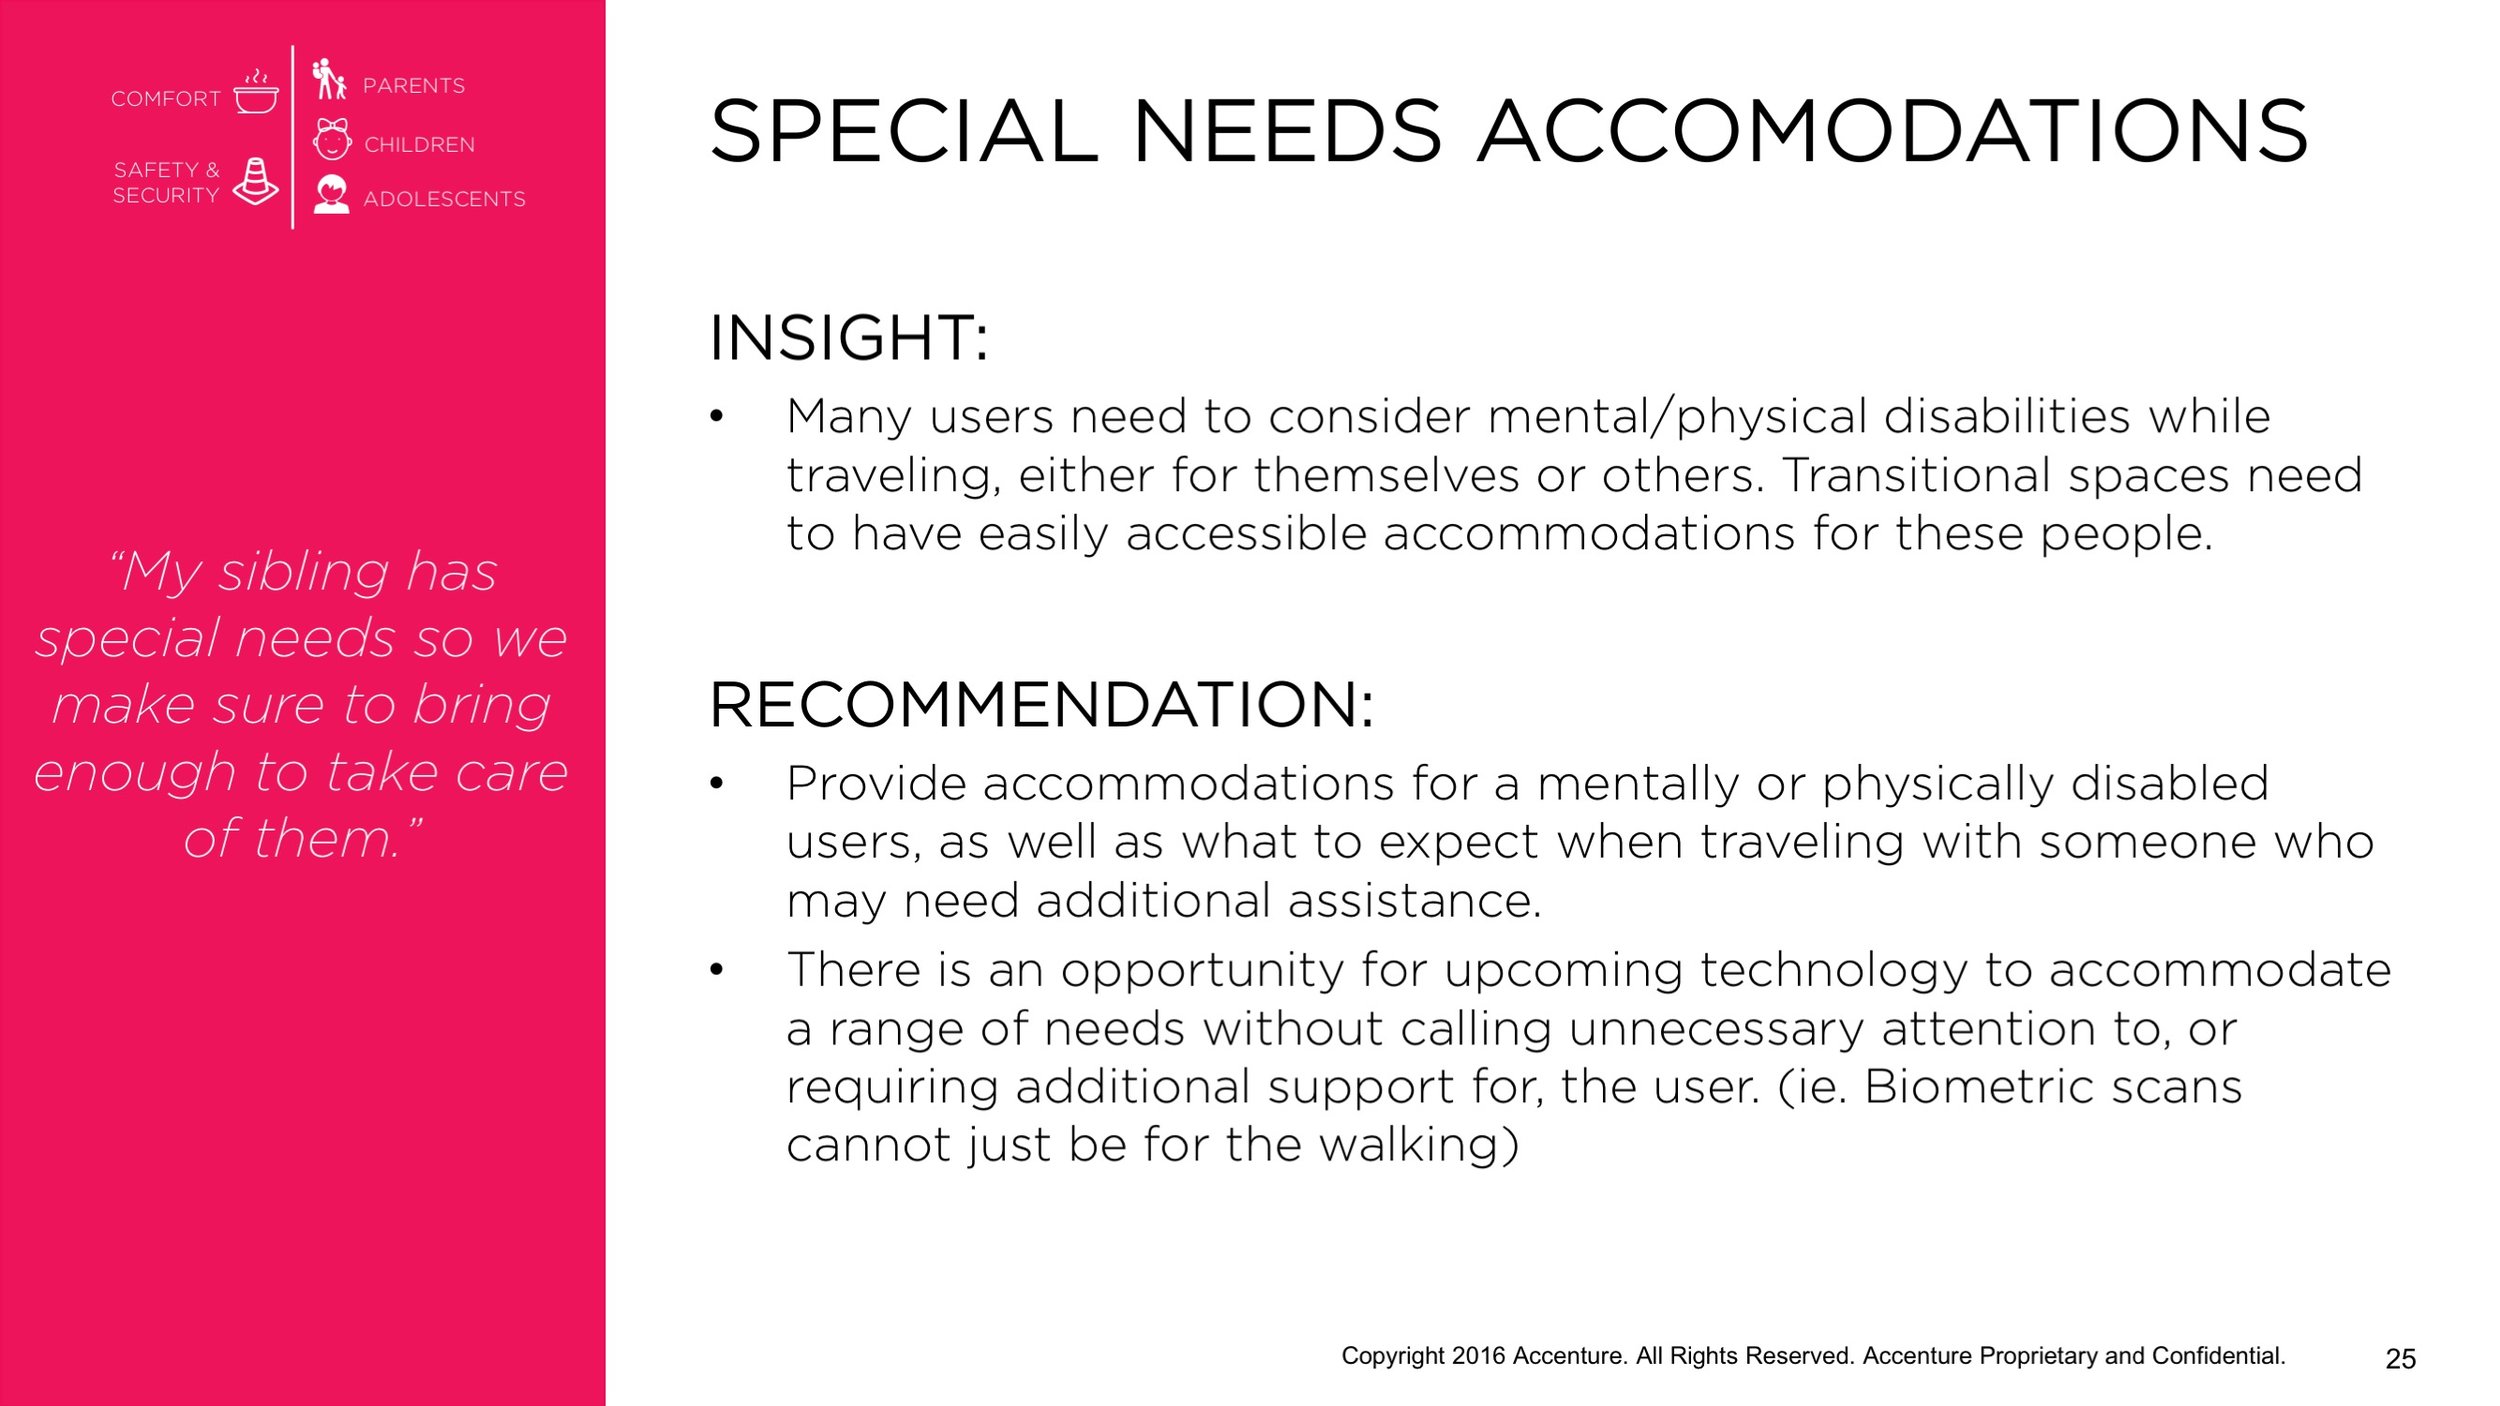
Research from the interviews and workshop was combined and synthesized using a thematic grouping approach focused on needs, pain-points, perspective, age, and role within the family. The summary of our findings is below:

Our full research read-out can be seen here:

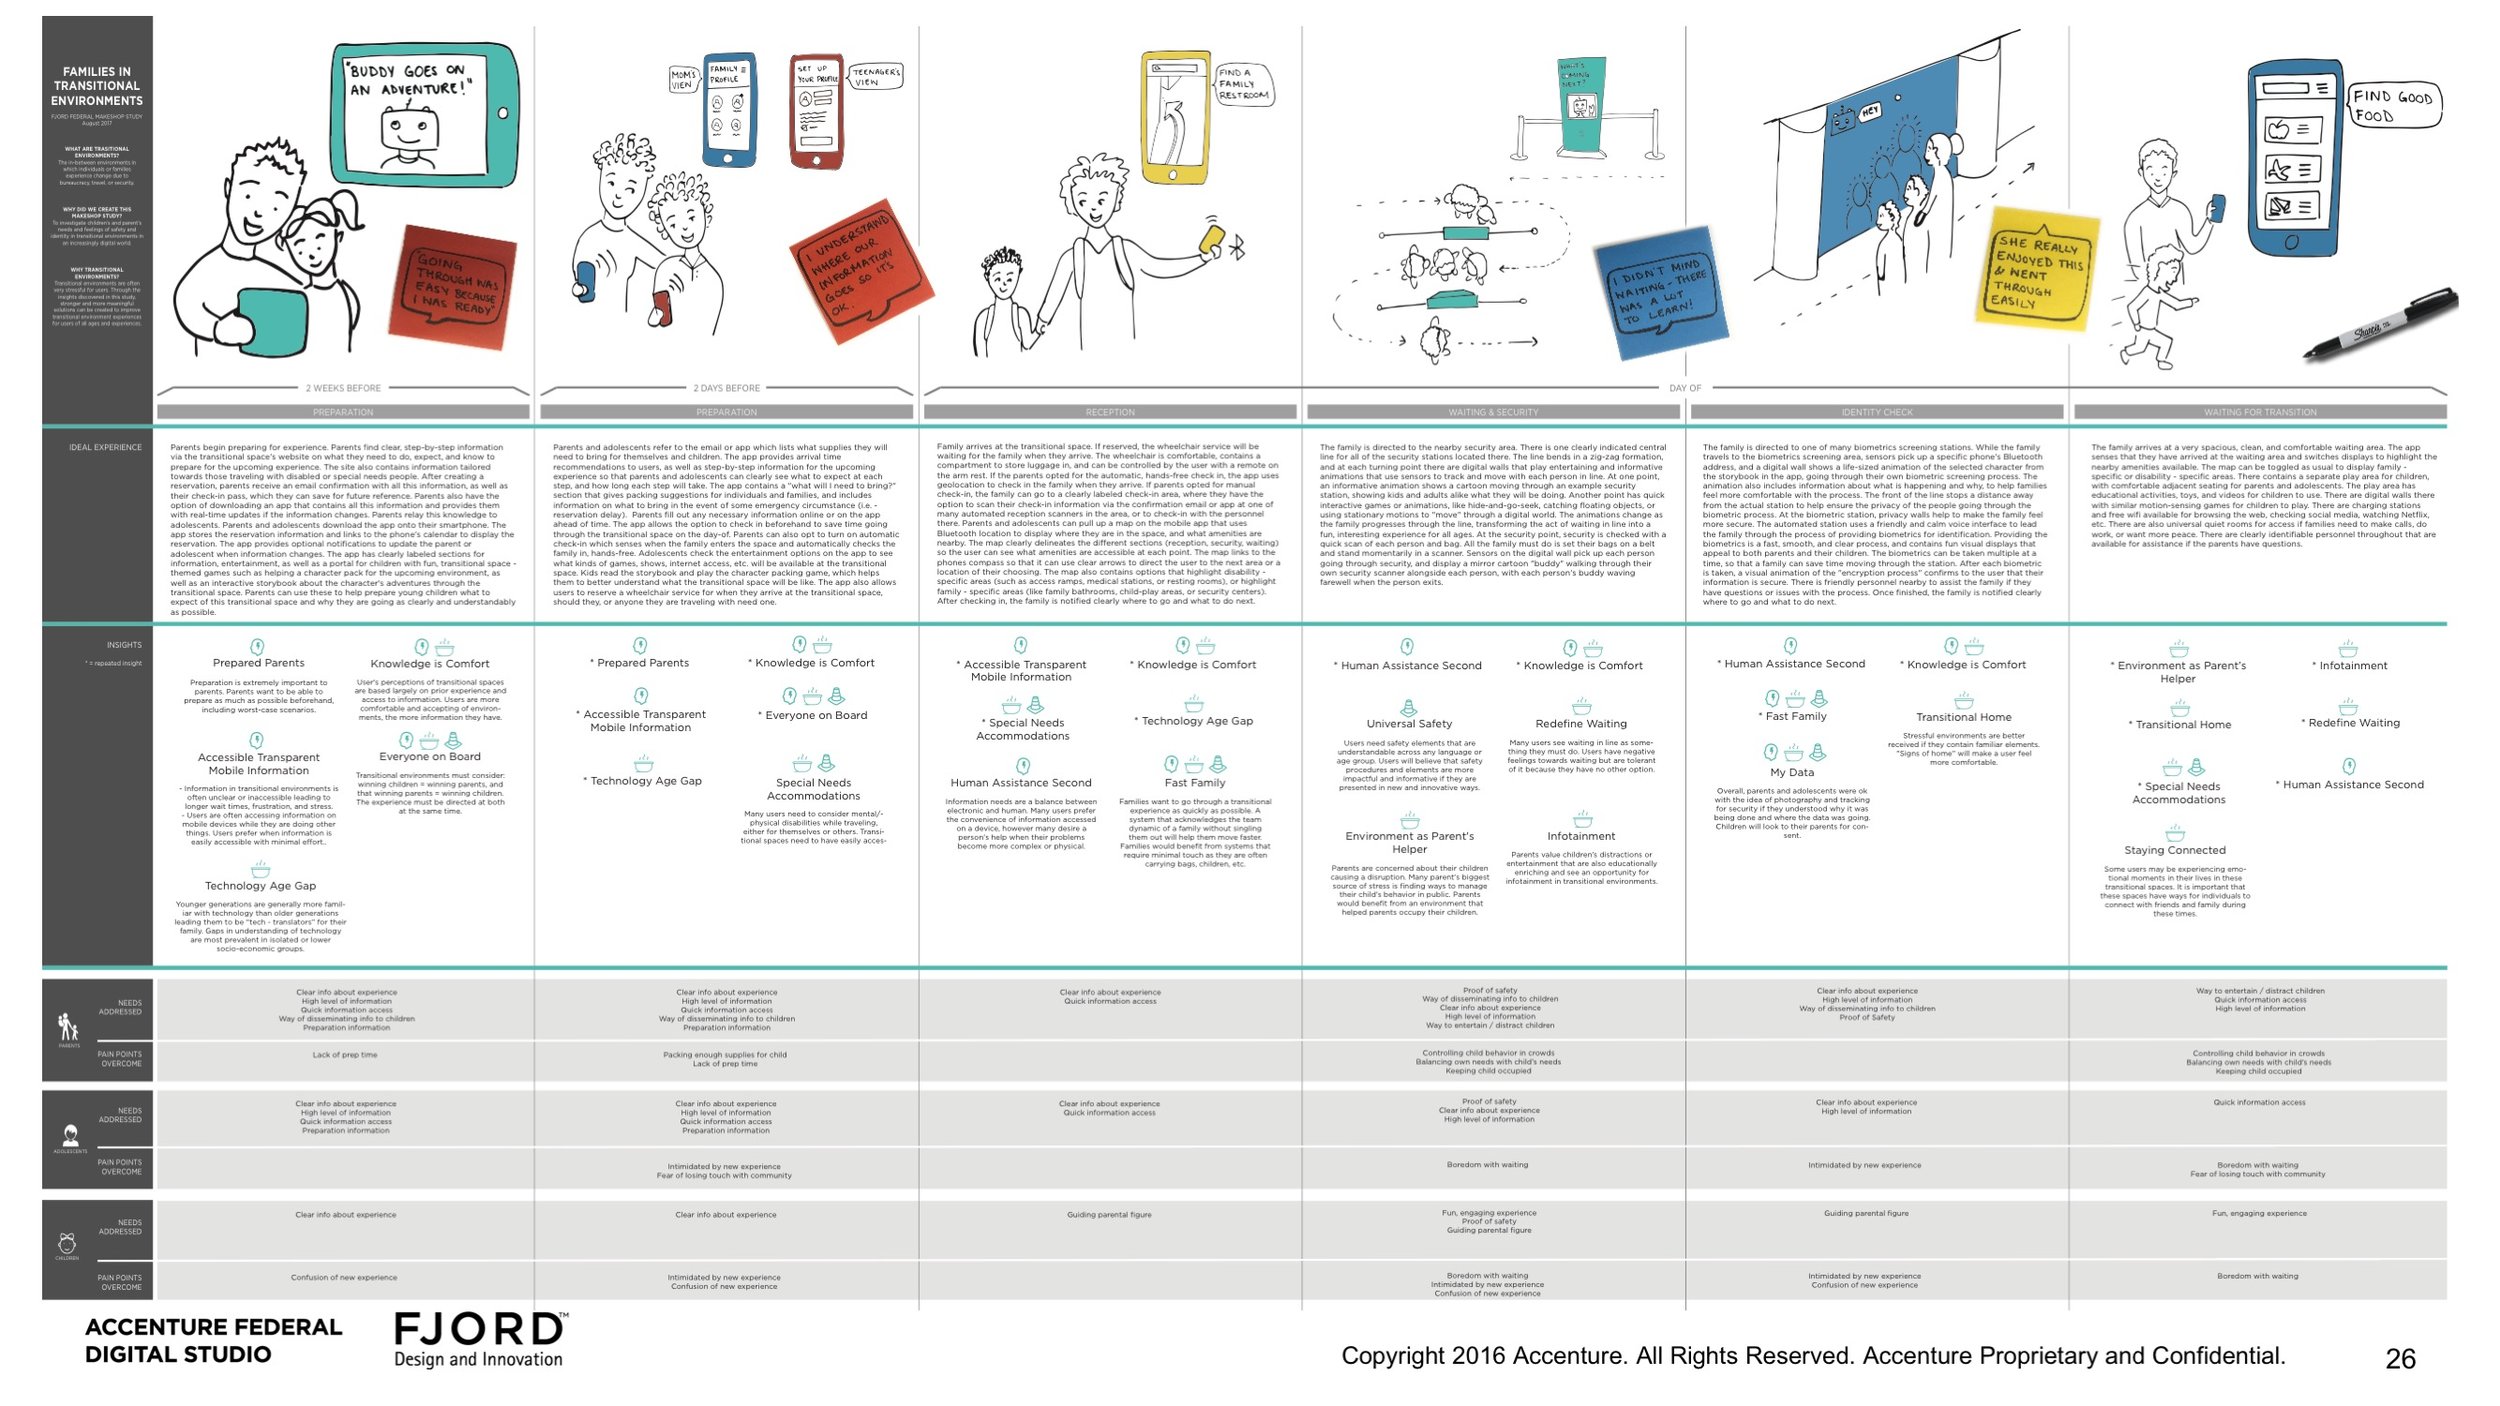
This research inspired our future-state concepts, which we mapped along a future state journey, and then expanded for a full blueprint:

Full blueprint.png